Electric Drive System Design, Simulation and Construction
| ✅ Paper Type: Free Essay | ✅ Subject: Engineering |
| ✅ Wordcount: 1585 words | ✅ Published: 31 Aug 2017 |
Abstract
In this experiment, three phase flexible inverter was used to drive a Brush Less Direct Current (BLDC) machine. Three experiments steps use three-phase inverter which is connected to resistor and inductor load and BLDC machine to examine and measure 1) Pulse Mode Modulation (PMW); 2) Three wave signal sinusoidal and 3) BLDC signal sequence. Computer simulation using MATLAB Simulink is used to analyze the laboratory result and software calculation. The speed and torque of BLDC machine can be controlled by controller using PWM technique. This BLDC machine can be modelled as Resistor and Inductor Load.
1.1 Background
Many electrical load (e.g. electric motor, lighting) need a wide of range voltage, current, frequency and phase angle which is converted from electrical source (e.g. electric grid, battery) with constant voltage, frequencies, current and phase angles. This conversion mechanism use power electronics converter and one application of converter is inverter which convert DC input into AC output [1]. In this experiment, this inverter will provide a variety of voltage and frequency to drive BLDC machine in order to operate at a specific speed and torque.
1.2 Module Aims
The aim of this experiment is to understand design, construction, simulation, and testing of an electrical drive system through practical experience. The procedure of this project can be divide into following steps.
- Research electrical drive technology.
- Construction of an electric drive.
- Simulate and understand an electric drive system.
- Experimental test, analysis and verification of the system
- Diagrammatic interpretation of software operation
- Production of a written technical report.
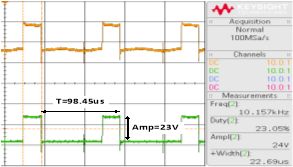
2.1 Pulse Width Modulation
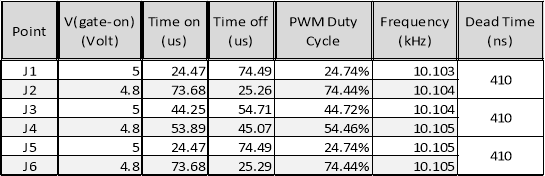
In this experiment, the circuit use 3 pairs of MOSFETs as shown in figure 2.1. Having set the PIC software to the PWM test mode for the controller, measurements was taken on terminal point in three pairs (J1-J2, J3-J4 and J5-J6) which indicate gate-on voltage.
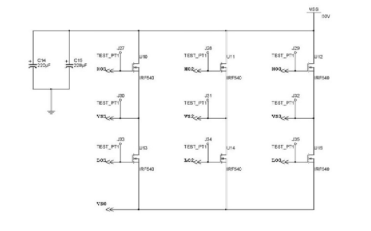
Figure 2.1. 3-phase MOSFET arrangement diagram.
The gate-on voltage on terminal J1-J2 over time can be shown in figure xx, it consists of time-on (T-on) and time-off (T-off). Time switching period can be calculated as T=t-on+t-off and duty cycle as ratio of time-on (T-on) over time switching period. The 3 pairs of MOSFET have relatively the same switching frequency and gate-on voltage, but in the different percentage of duty cycle, as complete result shown in table xxx. From figure xx, dead time is calculated as time span from J1 when voltage start to off and J2 when voltage start to on.
PMW switching frequency =
Duty cycle =
|
Figure 2.2. PWM signal for J1 (Yellow) and J2 (Green): time-on, time-off and voltage on. |
Figure 2.3. PWM signal: dead time between J1 (Yellow) and J2 (Green). |
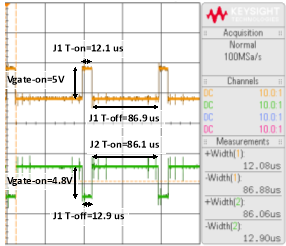
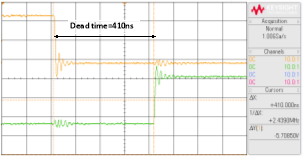
Table 2.1. PWM Signal (J1 to J6)
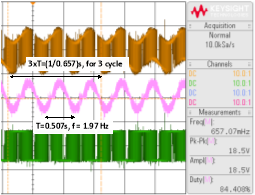
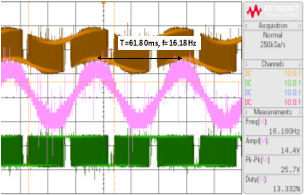
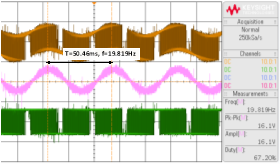
2.2 Three Phase Sine Wave Generator
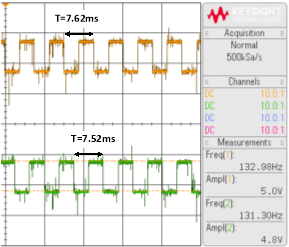
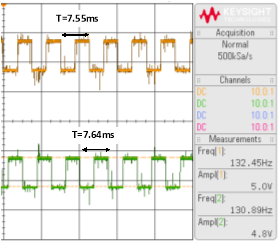
In this experiment, the controller is programmed with test 2 test to convert from DC supply to 3-phase AC output. The output of inverter connected to electrical load (resistor and inductor) and then voltage is measured between resistor R1. The frequency of AC output can be altered by the R22 potentiometer.
By varying the setting of potentiometer, the result between resistor R1 (V1-V2) can be shown in figure 2.1 for minimum, figure 2.2 for middle, and figure 2.3 for maximum setting of potentiometer.
2.3 BLDC Motor Control
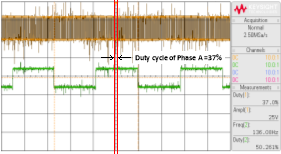
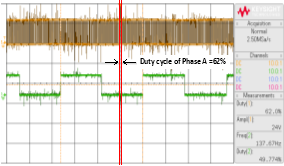
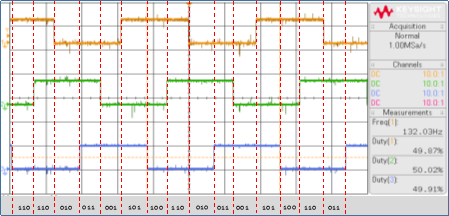
In the test-3, the controller is programmed with test 3 test to convert from DC supply to operate and control a three phase BLDC machine. BLDC machine is equipped with three Hall Effect sensors, their function is to sense the rotor position to the controller in order to make MOSFETs can make certain switching arrangement to produce a particular speed for BLDC motor.
After inverter connected to hall effect sensor and to power supply of BLDC motor, the results can be shown for the sequence position between H1-H2 (figure xx), between H1-H3 (figure xx) and also the total sequence position between H1-H2-H3 in figure xx. The supply voltage for BLDC, phase A voltage is can be shown in figure xx and figure, which magnitude at around 25 V but the duty cycle fluctuate between range 37% up to 62%.
2.4 Variable DC Supply Simulation
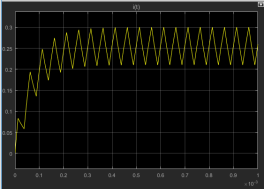
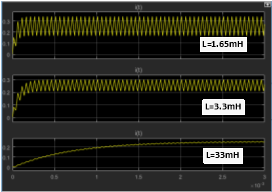
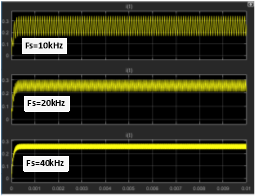
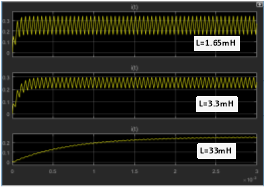
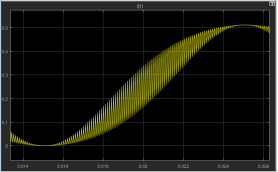
In this Matlab simulation, DC supply was connected to resistive-inductive load with the value of R=47Ohm and L=33mH. DC output was produced by compare the triangle waveform and a reference setting point. The triangle waveform magnitude has minimum value -1 and maximum value +1 with a frequency 20kHz. The reference setting point was set at 0, 0.5 and 1 which represent duty cycle (D=0%, D=50% and D=100%).
The shape of current waveform with duty cycle can be shown in figure xx. There are several screens captures with a variation of 1) the reference setting point (figure xx), 2) the triangle switching frequency and 3) the value of inductance.
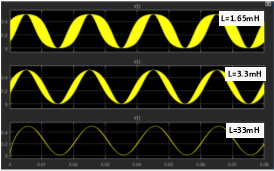
2.5 Variable AC Supply Simulation
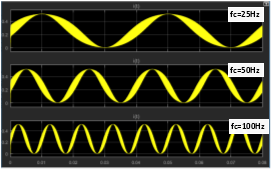
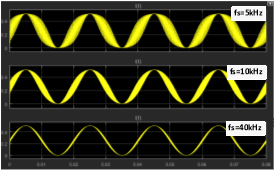
In this AC supply, AC supply was also connected to resistive-inductive load with the value of R=47Ohm and L=33mH. AC output was produced by compare the triangle waveform and a sinusoidal control signal. The triangle waveform magnitude has minimum value -1 and maximum value +1 with a frequency 10kHz. The reference was a sine wave with frequency 50 Hz and magnitude varying from maximum +1 and minimum -1.
The shape of current waveform with duty cycle can be shown in figure xx. There are several screens captures with a variation of 1) the sine wave reference signal (figure xx), 2) the triangle switching frequency and 3) the value of inductance.
3.1 Pulse Width Modulation (PWM)
This MS Word template (.dot file) was prepared by Dr. Jonathan I. Maletic in the Department of Computer Science at Kent State University. This is Version 1.0. It is a template for Thesis/Dissertations for the College of Arts and Science at KSU.
3.2 Three Phase Sine Wave Generator
In this Matlab simulation, DC supply was connected to resistive-inductive load with the value of R=47Ohm and L=33mH. DC output was produced by compare the triangle waveform and a reference setting point. The triangle waveform magnitude has minimum value -1 and maximum value +1 with a frequency 20kHz. The reference setting point was set at 0, 0.5 and 1 which represent duty cycle (D=0%, D=50% and D=100%).
The shape of current waveform with duty cycle can be shown in figure xx. There are several screens captures with a variation of 1) the reference setting point (figure xx), 2) the triangle switching frequency and 3) the value of inductance.
3.3 BLDC Motor Control
In this AC supply, AC supply was also connected to resistive-inductive load with the value of R=47Ohm and L=33mH. AC output was produced by compare the triangle waveform and a sinusoidal control signal. The triangle waveform magnitude has minimum value -1 and maximum value +1 with a frequency 10kHz. The reference was a sine wave with frequency 50 Hz and magnitude varying from maximum +1 and minimum -1.
The shape of current waveform with duty cycle can be shown in figure xx. There are several screens captures with a variation of 1) the sine wave reference signal (figure xx), 2) the triangle switching frequency and 3) the value of inductance.
3.4 Variable DC Supply Simulation
In this AC supply, AC supply was also connected to resistive-inductive load with the value of R=47Ohm and L=33mH. AC output was produced by compare the triangle waveform and a sinusoidal control signal. The triangle waveform magnitude has minimum value -1 and maximum value +1 with a frequency 10kHz. The reference was a sine wave with frequency 50 Hz and magnitude varying from maximum +1 and minimum -1.
The shape of current waveform with duty cycle can be shown in figure xx. There are several screens captures with a variation of 1) the sine wave reference signal (figure xx), 2) the triangle switching frequency and 3) the value of inductance.
3.5 Variable AC Supply Simulation
In this AC supply, AC supply was also connected to resistive-inductive load with the value of R=47Ohm and L=33mH. AC output was produced by compare the triangle waveform and a sinusoidal control signal. The triangle waveform magnitude has minimum value -1 and maximum value +1 with a frequency 10kHz. The reference was a sine wave with frequency 50 Hz and magnitude varying from maximum +1 and minimum -1.
The shape of current waveform with duty cycle can be shown in figure xx. There are several screens captures with a variation of 1) the sine wave reference signal (figure xx), 2) the triangle switching frequency and 3) the value of inductance.
Cite This Work
To export a reference to this article please select a referencing stye below:
Related Services
View all


DMCA / Removal Request
If you are the original writer of this essay and no longer wish to have your work published on UKEssays.com then please click the following link to email our support team:
Request essay removal