Workforce Obsolescence
| ✅ Paper Type: Free Essay | ✅ Subject: Engineering |
| ✅ Wordcount: 4081 words | ✅ Published: 30 Aug 2017 |
The loss of critical skills, i.e., the disappearance of non-replaceable workforce, is a problem faced by many product sectors tasked with supporting critical systems. This problem is common for organizations that must manage the DMSMS-type obsolescence problems for hardware, software and materials discussed in the other chapters of this book.
For some products, the loss of worker skills and experience can be mitigated by simply adjusting hiring rates and instituting training of younger workers, however, in other sectors experience can be very difficult to replace. This chapter focuses on the loss of critical skills that are either non-replaceable or take prohibitively long times to reconstitute.
13.1 Defining Workforce Obsolescence
Mismatches between the skills possessed by the workforce and the skills needed by employers create a number of issues that complicate the long-term manufacturing and sustainment of systems. These mismatches have been classified into the following three general categories: skills obsolescence, skill shortage, and critical skills loss.
Skills obsolescence (also referred to as human capital obsolescence) describes situations in which workers lack the skills needed to either become employed or remain employed, (De Grip and Van Loo, 2002). This often includes the segment of the workforce that have skills, but those skills are obsolete requiring retraining of the worker. Where obsolete skills refer to skills that are no longer needed.
Skill shortage describes situations where there are insufficient available skill competences to fill the needs of an organization, e.g., (Green et al., 1998). Skills shortage articulates the need to identify, train and retain the workforce to fill current and expected future skill needs. Skills shortage has many causes including the speed of technology advancement, e.g., (Duan et al., 2002), training and education gaps (Skinner et al., 2004), and can also be the result of an organization’s inability or failure to protect its core skill competencies over long periods of time or during economic downturns (Melymuka, 2002).
Critical skills loss is relevant to this book and is the focus of this chapter. Critical skills loss refers to the loss of skills that either cannot be replaced or require a prohibitively long time to reconstitute, (Sandborn and Prabhakar, 2015). In this case reconstitution of the skills may require many years if possible at all. Critical skills loss is a special case of “organizational forgetting”, i.e., the loss of knowledge gained through learning-by-doing. Organizational forgetting can be caused by labor turnover, periods of inactivity, and/or failure of an organization to institutionalize tacit knowledge (Brsanko et al., 2010). Critical skills loss is a permanent and involuntary form of organizational forgetting that may be unrecoverable. Critical skills loss (in the context of legacy system support) is the result of long-term (20+ years) of workforce attrition where highly-skilled workers retire without a sufficient number of younger workers to learn their skills and take their place.[1] Critical skills loss is not necessarily the result of poor planning or lack of foresight (and although activity is light, it is not nonexistent); rather it is an inevitable outcome of the organization’s dependence on a highly-specialized highly-critical skill set for which there is small, but non-zero, demand, (Sandborn and Prabhakar, 2015). It should be stressed that critical skills loss is a long-term phenomenon – it occurs gradually over 20+ years, i.e., over the span of several generations of management coupled with mergers, acquisitions, and product line changes, critical skills often diffuse and eventually disappear.
In the context of this book, the salient issue that defines workforce obsolescence for legacy mission-, infrastructure-, and safety-critical systems is “critical skills loss”.
13.2 How Critical Skills Loss Impacts Systems and Where it Comes From
Critical skills loss is rarely a problem in high-volume low-skill manufacturing applications, e.g., assembly-line workers. For these applications, an appropriate workforce nearly always exists or can be readily constructed through training programs. However, managing human skills obsolescence is becoming a significant problem for organizations tasked with supporting legacy systems. These support organizations need to be able to understand, forecast and manage a highly-specialized workforce with potentially irreplaceable skill sets.
The system support and management challenges created by the loss of critical human skills have been reported in many industry sectors including: healthcare (Waldman, 2004), nuclear power (Nuclear Workforce Planning, 2008), aerospace (Testimony of Elliot Pulham, 2002), and other enterprises(Leibold and Voelpel, 2002). In the IT industry, the shortage of mainframe application programmers experienced in legacy applications is very problematic, (Goodridge and McGee, 2002) and (Hilson, 2001); in this case the necessary skills are no longer being taught because demand has dropped and younger workers interests are elsewhere. The loss of critical skills is most troublesome for organizations that must provide long-term support for legacy systems. For example, for defense systems, the loss of critical skills is potentially devastating: “Even a 1-year delay in funding for CVN-76 [aircraft carrier] will result in the loss of critical skills which will take up to 5 years to reconstitute through new hires and training. A longer delay could cause a permanent loss in the skills necessary to maintain our carrier force.” (Congressional Record, 1994).
The causes of critical skills loss include: education and training declines (e.g., universities no longer educate engineers in the programming languages that are used in many legacy systems, (Shead, 2013); younger workers may perceive that certain occupations are in decline, e.g., nuclear power (Nuclear Workforce Planning, 2008) and are therefore discouraged from entering them; similarly younger workers may perceive certain occupations as not cutting-edge and therefore not enter them (Ahrens et al., 1995) (Adolph, 1996); younger workers may leave jobs supporting legacy systems to pursue other positions that appear to be more lucrative and exciting (Figure 13-2 in Section 13.3.3 shows an exit age distribution for a legacy control system); the shrinkage of “feeder” occupations, e.g., historically the U.S. Navy has provided highly-skilled workers to the nuclear power industry (Nuclear Workforce Planning, 2008); older workers protecting their jobs by not passing knowledge along to younger workers, e.g., (AndolÅ¡ek, 2011); and fundamental differences between young and old workers regarding job perceptions (i.e., social and cultural influences) (Goodridge and McGee, 2002).
13.3 Quantifying the Impact of Critical Skills Loss
Critical skills loss impacts the sustainment of mission-, infrastructure- and safety-critical systems. As the human capital that possesses the skills to support a system shrinks, the time that the system is down (non-operational) when the system requires support will increase. Downtime increases lead to increased business interrupt time, which results in a loss of revenue for manufacturing systems. Increases in downtime in the transportation, defense and service industries decreases system availability, which can lead to a loss of revenue, safety compromises, property damage, and loss of life (e.g., emergency vehicle unavailability).
In this section, we briefly review the applicability of some existing models to quantifying the impact of critical skills loss and then describe one modeling approach that estimates the financial impact of the problem.
13.3.1 Existing Approaches
Nearly all of the existing modeling and quantitative treatments address the problem of skills obsolescence, which is a different problem than the critical skills loss problem addressed in this chapter. Most skills obsolescence treatments assume that workers’ skills become outdated or are otherwise no longer useful, possibly as a result of automation and other advances in technology. These works focus on the mitigation of skill “decay” in a workforce over time. The only existing work applicable to critical skills loss focuses on knowledge preservation, i.e., the capture of non-replenishable knowledge, (Joe and Yoong, 2004) (Hailey and Hailey). Some applicable work has also been done on retirement wave planning (Friel, 2002); however, this work focuses on head count rather than skill content.
The modeling performed by Bohlander and Snell (2010) addresses a situation that is similar to critical skills loss, however, worker attrition and the costs associated the unavailability of the workers is not considered. In Bordoloi (1999), a model for different skill level workers that enter and exit a company is developed; the model takes into account the rate at which the company gains and loses workers. However, the model in(Bordoloi, 1999) does not estimate worker’s experience as a function of time and therefore does not determine the impact of critical skills loss on supporting systems. In the planning model developed by Huang et al.(2009) the goal is the determination of an ideal hiring rate using differing worker skill levels. While this model uses workforce simulation and determines the ideal hiring rate, the model does not take into account the costs incurred by the unavailability of workers.
The basis for most workforce planning models is the “physical sum of people employed,” (Holt, 2011). However, the model developed by Holt, however, does not consider the aging of individual workers over time. There are models that have some applicability to critical skills loss in the maintenance workforce planning literature, e.g., (Koochaki et al., 2013) (Martorell et al., 2010) (Ait-Kaki, et al. 2011) and (Ahire et al., 2000). These models focus on optimizing maintenance scheduling and resource allocation. Maintenance policies have the goal of maximizing plant or process line availability while concurrently minimizing cost through the timely presence (and appropriate skill set) of maintenance workers. Koochaki et al., 2013) points out that “maintenance workers are usually highly skilled and therefore difficult to recruit” and that “the efficient and effective use of a scarce maintenance workforce is very important”. The model in (Koochaki et al., 2013) addresses the impact of limited maintenance workers (i.e., maintenance resource constraints) on the grouping of maintenance activities while comparing age-based replacement and condition-based maintenance (CBM). In (Ahire et al., 2000), the makespan (which is the total length of the schedule) is minimized for a groups of preventive maintenance tasks constrained by workforce availability. Other papers treat the influence of CBM on maintenance scheduling and workforce planning, for examples see (Koochaki et al., 2013) and the references contained therein. In general these references focus on the determination of the optimum size maintenance workforce.
13.3.2 Modeling Human Skills Loss
A detailed model for the loss of non-replinishable maintenance resources has been developed in (Sandborn and Prabhakar, 2015) and (Sandborn and Williams, 2016). The technical development of the model is briefly summarized here, see (Sandborn and Prabhakar, 2015) and (Sandborn and Williams, 2016) for more detail. The model uses historical workforce data to forecast the size and experience of the workforce pool as a function of time. The workforce experience pool is then used to determine the cost of supporting (sustaining) a system as a function of time. The model was created to address the questions: “what will today’s skills pool look like in the future?” and “what impact will the future skills pool have on the organization’s ability to continue to support the system?”
A key assumption in this model is that sufficient experience exists today to adequately support the system, and we wish to forecast the future workforce skills pool’s “experience” relative to today’s skills pool. The model has four primary inputs: a current age distribution (fC), a hiring age distribution (fH), an exit age distribution (fL) and the hiring rate (H). Assuming a stationary analysis, the distribution of exit ages (fL) and the distribution of hiring ages (fH) and are constant. This does not mean that the same number of people are hired each year, but rather that the hired people’s ages are always distributed equivalently. The same assumption is made for fL. The distribution of current ages (fC) is used as an initial condition.
To assess workforce pool size and experience over time, we must project the experience of the workers in the pool into the future. This projection starts with the initial conditions in the pool and accounts for age related loss and subsequent hiring. The level of experience within the skills pool changes over time and can be determined from: 1) the new hires added to the skills pool; 2) the attrition (loss) rate of skilled workers; and 3) the varying skill levels of the workers in the pool and how those skill levels (experience) increase as workers remain in the pool.
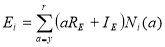
The net frequency of people in the pool of age a during year i relative to year 0 is given by,
 (13-1)
where, i is the number of years from the start of the analysis, a is age, and Hi is the fraction of new hires per year (fraction of the pool size at the start of the analysis period i = 0). The first term in the brackets in Equation 13-1 is the current workforce pool size (relative to year 0), the second term in the brackets in Equation 13-1 is the number of new hires (relative to year 0), and the multiplier accounts for the retention rate. Note, Equation 13-1 assumes that the hiring rate, Hi is the same for all ages, a.
The initial condition for the model is that the fraction of people of age a relative to year 0 in year 0 is given by, . The cumulative net frequency of people in the skills pool, NNET, in year i is determined by summing Ni(a) over all the ages (y = youngest to r = retirement),
 (13-2)
Calculating the size of the workforce pool (head count) over time is necessary but not sufficient to capture an organization’s future ability to support a system because workers have different levels of experience. Because of the varying experience, not all workers provide an equivalent level of “value” to the support of the system. In this model, experience is defined as the length of time that a worker has spent in a particular position. The cumulative experience in the workforce pool in year i, Ei, is calculated using,
 (13-3)
where, RE and IE map age to the experience measured in years (RE and IE are determined using a parametric model from actual data). Note, while “experience” has the units of time, Ei, which is used in this model, represents the cumulative experience relative to the initial condition.
The time to perform maintenance in year i is found from the cumulative experience using,
 (13-4)
where,  is the time to perform a maintenance activity with a skills pool having E0 experience at i = 0. In Equation 13-4 the time required to perform maintenance increases as experience decreases due to the following factors: 1) less-experienced workers require more time to perform maintenance (learning curve effects), and/or 2) if the pool of workers capable of performing the required maintenance task shrinks, appropriate workers may not be available at every site and may have to travel from a different location, which takes time.
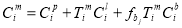
The most significant impact of the loss of critical human skills for legacy systems is the ability to perform system support (corrective maintenance) in a timely manner. Corrective maintenance costs consist of: spare parts, labor, downtime, overhead, consumables/handling, and equipment/facilities. When a corrective maintenance event occurs, the cost of performing the required maintenance action is,
 (13-5)
where  is the fraction of the maintenance events of severity level j that result in a business interrupt,
  is the cost of replacement parts (if replacement parts are needed) in year i,
 is the cost of labor (per unit time) in year i (with appropriate overhead applied), and
  is the cost of business interrupt (per unit time) in year i.
  , and
, and  are assumed to be discounted using an appropriate discount rate.
13.3.3 Example System Support Case Study
A detailed case study was previously published in (Sandborn and Prabhakar, 2015) and (Sandborn and Williams, 2016). In this section we only provide a few highlights from that case study. The case study considered the support of a legacy control system for a chemical product manufacturing company (the system was originally developed and deployed in the 1970s) and has over 2000 instances (plants) installed and currently operating and supported worldwide. In this case, because the process line availability is very important, unscheduled downtime cannot be tolerated.
The model overviewed in Section 13.3.2 requires three distribution inputs: the current age distribution (fC), the distribution of hiring age (fH) and the distribution of exit age (fL). Two of these distribution inputs are readily available from organization’s field data: the hiring age (fH) and a current age distribution (fC), Figure 13-1. The current age distribution (in Figure 13-1b) has a mode of 55 years, which is very close to the early retirement age in the organization, thereby demonstrating the issue that this chapter is focused on.
The exit age distribution (fL) shown in Figure 13-2 for this case study was synthesized using the distributions for fH(a) and fC(a) in Figure 13-1 along with the assumption of a stationary process. Figure 13-2 is a “bathtub curve”. It indicates that workers either exit early or exit late (but few exit between ages 45 and 60. The younger workers exit because they are changing jobs within the company. The company modeled in this case study, has had difficulty retaining young workers (engineers) to support the legacy system. The younger engineers have a tendency to relocate to other job opportunities within the company that they perceive as having better long-term career prospects. Above age 60 the workers are retiring. Figure 13-2 supports the critical skills loss observation made in Section 13.2 that younger workers leave legacy system support jobs (presumably for other positions).
The number of workers (pool size) is shown in Figures 13-1 and 13-2, but the experience contained within the pool is not reflected in these distributions. To get from pool size to the workforce pool experience, the mapping from age to applicable experience is needed. The parameters for the mapping function in Equation 13-3 were generated from the years of experience (on the control system) and the years of service to the company.
The net pool size (number of workers) over time as a fraction of the pool size in 2010, NNET, is shown in Figure 13-3a. Figure 13-3b shows the experience relative to 2010, and Figure 13-3c shows the average age of the workers in the pool. The results in Figure 13-3 assume no hiring, H = 0. Figures 13-3a and 13-3b indicate that although a 10% drop in head count occurs in the first 6 years, the experience remains approximately constant (existing workers are gaining enough on-the-job experience to offset the drop in head count). After 2016, the experience drops as the oldest and most experienced workers leave and are not being sufficiently replenished.
Assuming that the lost skills are replenishable (they are not for the real company treated in this case study), we can estimate what the future hiring rate, Hi, would have to be to preserve the initial level of experience, E0, in the skills pool. Equation 13-1 is used to determine the annual hiring rate, Hi, that is required to replenish the cumulative experience lost as a result of attrition and retirement. Figure 13-4 shows results for hiring rate, Hi, relative to the initial pool size P0as a function of the number of years from the start of the analysis.
Figure 13-4 shows that no hiring is required in the first five years (we are not allowing hiring to drop below 0, a hiring rate below 0 would reflect a layoff situation). A hiring rate of over 6% is required starting in 2017 for 9 years and then settles to 2-5% for all the years thereafter. When H is greater than zero in (4), the hiring rate is applied to the entire hiring age distribution, fH. The required hiring rate solved for in Figure 13-4 accounts for both the time required for new workers to learn the skills necessary to support the system and the exit age distribution in Figure 13-1.
Figure 13-5 shows the annual cost of supporting the legacy control system through year 2040 (all 2000+ instances of the system are costed here). The cost modeling is performed using a stochastic discrete-event simulator that samples time-to-failure distributions for the components of the control system to obtain maintenance events (determining the maintenance event dates and the components that need replacement). Subsystem-specific (and severity category specific[2]) failure distributions are sampled to obtain failure dates for the system. At each maintenance event, maintenance resources are drawn and a cost is estimated using Equation 13-5. Most of the maintenance events do not result in business interrupt time because they only impact one of the two parallel control systems and = 0, however, a small fraction (the most severe events) result in dual control system failures where > 0. The risk of dual failures and the resulting business interrupt is captured by the differing severity categories. The specific data associated with the system count, the subsystem/severity category reliabilities, and the cost of business interrupt time is proprietary to the customer and therefore not included here.
For this case study,  was determined to be 0.54, meaning that when the number of people in the pool drops below 54% of the number that are in the pool initially (in 2010), the extra maintenance time penalty (modeled by (15)) is applied.
Figure 13-5 shows two support cost results. The results demonstrate that there is minimal effect of skills loss prior to 2030. In year 2028 existing lifetime buys of spares parts (hardware) start to run out resulting in the cost step between 2028 and 2030. We obtain the lower curve in Figure 13-5 when there is no skills loss, Ei/E0 = 1 for all i in Equation 13-4. In this case there is still an annual cost increase caused by part obsolescence that is mitigated via lifetime buys of parts (these buys commit significant capital to the pre-purchase of spare parts and long-term holding costs). The higher cost curve in Figure 13-5 is the case where no replenishment of lost skills is possible (H = 0), this is close to reality for the company considered in this case study.
13.4 Discussion
Workforce planning means ensuring that you have the right number of people, with the right skills sets, in the right jobs, at the right time. This chapter presents a model that enables workforce planning in cases where the workforce is non-replenishable. The model developed estimates both the number of skilled employees (workforce pool size) and the cumulative experience in the workforce pool. This information is used to determine the resources available to maintain a system as a function of time. Cumulative experience dictates the time (and the resultant cost) required for workers to perform the maintenance activities necessary to support the system. Because of the prohibitively large cost of legacy system replacement, these systems are rarely replaced unless a catastrophic failure occurs or their support costs become impractical. The model can potentially be used by companies to support the development of business cases for system replacement, see (Sandborn and Prabhakar, 2015).
Numerous important assumptions were made in the development of the model. In the solution presented here, we assume that years on the job is the only way workers can gain experience. We have not accounted for methods that could be used to accelerate the rate at which workers become more experienced, e.g., capturing older workers knowledge in knowledge bases [29,30] could accelerate experience. We have performed a discrete-time analysis because the input data that was available to us only exists annually. A continuous-time solution could also be developed, but one must be careful to match the model to the form of the input data.
There are several indirect consequences of the loss of critical skills that we have not addressed, and which would be challenging to quantify in terms of cost. The workers that are maintaining systems (particularly engineers) are likely to be performing other beneficial tasks in addition to corrective maintenance. Besides corrective maintenance, they may also perform: preventative maintenance, projects intended to upgrade the reliability and/or performance of the system, and knowledge transfer activities. As workforce resources decrease, it is reasonable to assume that all tasks, except corrective maintenance, would decrease. Even if sufficient resources remain available for corrective maintenance tasks, an inability to perform the other tasks that the engineers might do results in a loss of: maintenance efficiency improvements, system reliability improvements that could decrease future maintenance requirements, and system performance. Further, if the job satisfaction amongst the engineers that are forced to only perform maintenance decreases then their retention may be negatively impacted.
There are other factors that may modify the case study presented herein. These factors include location (culture certainly impacts the likelihood that highly-skilled workers remain in system support jobs), gender, the product sector, etc. These effects could be analyzed with the presented in this chapter model if sufficient data existed.
[1] For many types of legacy systems, 5 or more years of on-the-job experience may be required to become competent.
[2] The level of maintenance required (which dictates the maintenance resources required) and the degree of business interrupt associated with the maintenance event are governed by the severity categories. See From (Sandborn and Williams, 2016) for details.
Cite This Work
To export a reference to this article please select a referencing stye below:
Related Services
View all


DMCA / Removal Request
If you are the original writer of this essay and no longer wish to have your work published on UKEssays.com then please click the following link to email our support team:
Request essay removal