Financial Analysis of Krispy Kreme Doughnuts Inc.
| ✅ Paper Type: Free Essay | ✅ Subject: Finance |
| ✅ Wordcount: 1478 words | ✅ Published: 23 Sep 2019 |
Financial Analysis of Krispy Kreme Doughnuts Inc.
History of Krispy Kreme Doughnuts Inc.
Krispy Kreme (KKD) was founded in 1937 by Vernon Rudolph. He started as a wholesaler by selling donuts to grocery stores and other shops that would sell them to customers. By the 50s, his donuts were so popular that he literally cut a hole right through the factory wall to sell directly to customers. This is the concept of KKD stores. Scott Livengood became CEO in 1998 and wanted to take the company public. He was able to do this in April 2000 in one of the largest initial public offerings (IPO) at the time. KKD entered the market with a share price at $40.63. In 2004, the company announced adverse results for the first time in its history as a public company which dropped the share price to $22.51. In 2005, investigations over KKD’s accounting treatment of acquisitions began and as a result, the stock price fell to $5.74.
Despite the issues mentioned above, KKD is still successful in certain parts of the world. They rely on 4 main revenue drivers; selling donuts in KKD stores, selling donuts in grocery and convenience stores, selling the machinery/equipment and donut/coffee mix to franchisees, and earning royalties and franchise fees from franchisees.
Historical Income statement and Balance sheet
When analysing the income statement of KKD we noted that their net income increased year after year and had a positive net income between 2000 and 2003. However, the success they had over the course of previous years since going public in 2000 was quickly forgotten, as a fell from grace over the course of 2004. The company had a negative net income of $24,428 in May 2, 2004, however; they could go back to positives in just three months. This reflects how strong the company’s management was and that they could quickly make adjustments to bounce back. In addition, when looking at the balance sheet we noticed that KKD’s cash, account receivables, and current assets increased between the periods of 2000 to February 2004 and are significantly higher than current liabilities. This indicates that the company is growing and it has enough cash to cover short term obligations. Additionally, the company’s expansion from 288 stores to 714 stores in four years shows the company’s growth capabilities (Appendix 1).

However, in 2004 KKD reached its peak of growth and their share price began to decline. The company’s debt increased annually while Net Income between May 5, 2003 and May 2, 2004 dipped by 154%, turning into a loss. This was also not helped by the trend of people dieting, which put the company at risk since their main product is a sugary carbohydrate. In addition, the company’s earnings per shares decrease to -$0.38 thousand dollars on May 2, 2004. From this it was clear that even though KKD started off with good financial health and was growing until the beginning of 2004. They took on too much debt too fast and expanded too quickly for their capabilities, leading to the company’s downfall and current financial struggle.
Financial Ratios and Understanding of the Company
Investors can use financial ratios to take a more specific look at certain financial metrics and in conjunction with industry data, can compare the ratios to industry standards to see how the company matches up. There are multiple types of ratios each serving specific purposes like identifying how a company manages its debt, how leveraged the company is and how the finance operations, and how effectively management utilizes the company’s assets. In comparison to the industry, KKD’s ratios tell investors that they are more solvent in the short term, have lower activity, hold more debt, and are also more profitable.
Dunkin Donuts has been identified as the top competition to Krispy Kreme and would provide a useful benchmark to the current performance of the two companies. Both companies are fairly solvent in the short term when comparing quick and current ratios, but debt to equity ratios show that Dunkin Donuts has significantly funded their operations through debt with Krispy Kreme being far more balance in comparison (Appendix 3). But when comparing profitability ratios and management’s ability to effectively use assets, Dunkin Donuts vastly outperforms Krispy Kreme Donuts (Appendix 3). This shows that the issues KKD experience are not industry widespread and the sharp decline in value of KKD could be due to poor management and a shift in the industry.
Intrinsic Value
Intrinsic value is the value of a company that is made up of both intangible and tangible factors. Intrinsic value takes into account the past performance of a company, but also what the company is projected to do. There are many examples of brands with a high intrinsic value. Apple is a name that comes to mind. The intrinsic value for KKD comes from their signature glazed donut, the concept of selling a donut experience and the KKD brand as a whole. Everyone can agree that there is definitely a value attached to KKD brand, but it is impossible to quantify with numbers with any certainty. For example, KKD is often associated with warm, high quality soft donuts, but this reputation isn’t quantified anywhere on the financial statements.
Comparison of KKD’s financial ratios between 2000-2004
KKD’s liquidity ratios rose steadily from 2000-2004 to 2.72 (QR) and 3.25 (CR). This is much higher than their competitors. Although it is generally good to have sufficient liquidity levels, too much liquidity can indicate that the company has too much idle cash on hand. When looking at KKD’s leverage ratios, the times interest earned ratio decreased from 124.29 in 2002 to 23.15 in 2004, indicating a reduced ability for KKD to service its debt. The asset turnover ratio for KKD has declined from 2.10 in 2000 to 1.01 in 2004, indicating that KKD’s management has not been effectively utilizing the company’s assets. KKD’s inventory turnover ratio ratio is much lower compared to other firms, indicating that KKD is not as efficient at producing and sellings its inventory compared to other firms. Overall, when comparing KKD’s financial ratios to other firms in the industry it shows that KKD is not as financially viable as its competitors.
Corporate Governance of KKD
In the year 2000, KKD’s share price reached an all time high of nearly $100 per share, which was short lived. The timing of KKD’s share price reduction from the years 2000-2004 can be linked to some significant events happening within the company. In 2003 KKD repurchased franchises and used aggressive accounting treatments and booked the purchase price as an intangible asset and inflated the purchase price for reacquired franchises and recorded interest interest received on overdue loans as revenue. This eventually led to a restatement of KKD’s financials and an investigation by the SEC. When this news went public, it negatively impacted investors and analysts views of KKD leading to a sharp decline in the company’s stock price. KKD also had an aggressive growth strategy and over stretched itself by wanting to open too many stores within too short a time period, leading to an over saturated market and a deviation from the company’s core values. Overall, KKD has demonstrated poor governance through adverse management decisions and weak internal controls that led to a sharp decline in KKD’s share price within a short period of time.
Citations
- CSIMarket. (2019, January 13). Krispy Kreme Doughnuts Inc. Retrieved January 13, 2019, from https://csimarket.com/stocks/single_growth_rates.php?code=KKD&epsnet
- Investorhub. (2019, January 13). Krispy Kreme Doughnuts. Retrieved January 13, 2019, from http://ih.advfn.com/stock-market/NYSE/krispy-kreme-doughnuts-KKD/financials
-
NASDAQ. (2019, January 13). Dunkin’ Brands Group, Inc. Stock Report. Retrieved January 13, 2019, from http://www.nasdaq.com/symbol/dnkn/stock-report
Yahoo Finance. (2019, January 13). DNKN : Summary for Dunkin’ Brands Group, Inc. Retrieved January 13, 2019, from https://ca.finance.yahoo.com/quote/DNKN?ltr=1
Yahoo Finance. (2019, January 13). KKD Quote Look Up. Retrieved January 13, 2019, from https://ca.finance.yahoo.com/quote/KKD?p=KKD - Zimmerman, M. (2014). Intrinsic vs. Extrinsic Value. Plato.stanford.edu. Retrieved 13 January 2019, from https://plato.stanford.edu/entries/value-intrinsic-extrinsic/
Appendices
Appendix 1: Store Growth
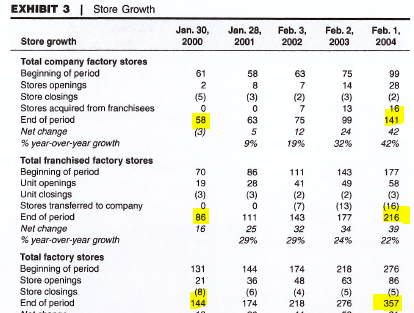
Stores in January 2000 = 58+86+144 = 288
Stores in February 2004 = 141+216+357 = 714
Appendix 2 : Industry averages
|
Competitor |
QR |
CR |
Debt ratio |
Long term debt |
Times Interest earned |
A:E |
AR turnover |
Inventory turnover |
|
Average |
0.62 |
0.98 |
57.24 |
66.54 |
97.58 |
2.22 |
40.03 |
68.96 |
|
Krispy |
2.72 |
3.25 |
11.26 |
10.12 |
23.15 |
1.46 |
9.7 |
17.76 |
|
Competitor |
Total asset turnover |
Cash turnover |
ROA |
ROE |
EBIT |
Net profit margin |
|
Average |
1.94 |
46.75 |
8.03 |
14.24 |
11.90 |
5.98 |
|
Krispy |
1.01 |
32.79 |
8.64 |
12.62 |
15.34 |
8.58 |
Note: Industry average were taken from the average of all numbers found in Exhibit 8 of the case.
Appendix 3: Krispy Kreme and Dunkin Donuts 2016 Financial Ratios
|
Ratios |
Krispy Kreme Donuts |
Dunkin Donuts |
|
Current Ratio |
2.00 |
1.43 |
|
Quick Ratio |
1.60 |
1.43 |
|
Debt to Equity |
0.05 |
-14.92 |
|
Interest Coverage |
32.0 |
3.79 |
|
Profit Margin |
0.10 |
0.24 |
|
Return on Assets |
0.10 |
1.20 |
|
Return on Equity |
0.10 |
6.09 |
Cite This Work
To export a reference to this article please select a referencing stye below:
Related Services
View all


DMCA / Removal Request
If you are the original writer of this essay and no longer wish to have your work published on UKEssays.com then please click the following link to email our support team:
Request essay removal