Food Frequency Questionnaires for Nutritional Assessment
| ✅ Paper Type: Free Essay | ✅ Subject: Nutrition |
| ✅ Wordcount: 3616 words | ✅ Published: 23 Sep 2019 |
Introduction
Diet plays a vital role in development; managing body weight; and disease prevention (WHO, 2018). Dietary intake assessment can assist in monitoring diet-disease relationship; assessing nutritional status; devising and evaluating recommendations/interventions; and in research (Cade et al. 2017; Kyle & Coss-Bu, 2010). Non-dietary methods, such as biomarkers, can accurately measure dietary constituents with minimal error from self-reporting and interviewer/recall bias. Nonetheless, use of biomarkers is invasive, costly, and they are not available for every nutrient (Naska et al. 2018). Dietary assessment methods also come with limitations. Weighed food diaries, the gold standard, provide direct and accurate measurement of intake, at the time of consumption, without recall bias (Shim et al. 2014). This method can be burdensome; time consuming; requires competent literacy and numeracy skills; access to a weighing instrument; and since diet is recorded in real-time, this method is not suitable for retrospective study (Ortega et al. 2015). A 24-hour multi-pass recall (24HMPR) is a retrospective recall of food consumed over the past 24-hours requiring estimation of portion sizes with the help of an interviewer. A 24HMPR is time consuming; does not reflect habitual diet unless conducted multiple times; requires a trained interviewer which can be expensive; and can be subject to recall/interviewer bias (Cade et al. 2001). Conversely, food frequency questionnaires (FFQ), based on indicating the frequency of consumption of food items, are cheap; quick; low burden; assess habitual intake; and can be tailored to measure intake of a specific nutrient. For these reasons, FFQs are suitable for assessing intake at a population level and in epidemiological studies (Sauvageot et al. 2013). FFQ data can be influenced by their design, recall bias, and accuracy of food composition databases. Henceforth, to confirm their accuracy, precision and suitability, validation is imperative (Hollis, 2016).
As previously mentioned, FFQs can assess intake of specific nutrients. Zinc is an essential mineral which plays a vital role in growth and immune function (Brown et al. 2001). Zinc cannot be produced in the body and is thus, essential in the diet. Inadequate intake can result in growth retardation, diarrhoea and increased risk of infection (Roohani et al. 2013). UK guidelines recommend an intake of 9.5mg/day for men and 7mg/day for women (NHS, 2017). Although mean intake exceeds the reference nutrient intake (RNI), 8% consume less than the lower reference nutrient intake (LRNI) (Food Standards Agency & Public Health England, 2018). Assessing zinc consumption is imperative in ensuring adequate intake and minimising health risks resulting from inadequacy. Current zinc-specific FFQs (Głąbska et al. 2018; Alsufiani et al. 2015; Samman et al. 2009) have been validated in very specific populations and against only one reference method. Given the limitations of dietary assessment methods, it is believed that combining two methods can improve the precision of results (Freedman, 2018). The aim of this study is to devise and implement an FFQ for assessing dietary zinc intake and to validate the FFQ in order to evaluate its suitability for use as a dietary assessment tool.
Methods
Participants & Anthropometric Measures
59 University of Glasgow students from the 2018/19 academic year participated as part of their MSc Human Nutrition degree. Participants attended a body composition practical where they, after a demonstration, measured and recorded their assigned partner’s height, weight and waist circumference using a SECA Leicester stadiometer (SECA, Germany); SECA877 scales (SE approval class III; SEA Germany); and standard tape measure respectively.
FFQ Development
Prior to the body composition practical, students were divided into groups tasked with creating a nutrient-specific FFQ and were provided with examples. After submission, students had a week to vote for which FFQ to validate. Instructions were provided on completing the semi-quantitative FFQ which could be completed on paper or online via Google Docs and concerned intake from the past month. The food-list was based on a literature search and McCance & Widdowson Composition of Foods Integrated Dataset. The outcome was a 33-item list grouped into categories combined with questions concerning alcohol, coffee and supplement consumption. Portion sizes and frequency (ranging from “never” to “2-3/day”) were adapted from previous FFQs and a visual guide was provided as an aid.
Reference Methods
Participants, provided with instructions and examples, completed a 3DWD on 3 consecutive days (two weekdays and one weekend day) by the end of the following week using household kitchen scales, either provided or already owned. Subjects described everything consumed; time of consumption; cooking method; weight/volume; recipes, brand name and nutritional information where applicable. If weighing was not possible (e.g. eating at a restaurant), participants referred to household measurements. To assess only what was consumed, leftovers were weighed and subtracted from the recorded weight. Participants provided their gender and date of birth with their 3DWD.
On a weekday during the final week of completing 3DWDs, subjects, after instruction, completed a 24HMPR with their partner interviewing them. Participants recalled everything consumed over the past 24-hours. Participants then went through their list in detail, providing information on time; cooking method; and portion size based on household measures. Finally, the interviewer reviewed the information and probed for additional information and potential missing items.
Data Collection
The group designing the FFQ developed a spreadsheet to calculate total daily zinc intake. Zinc content of each food was selected from the McCance & Widdowson Composition of Foods Integrated Dataset due to this being a UK-based study and assuming diets would reflect this. Zinc content of foods were converted to per portion and multiplied by number of servings/day. Figures were added together to provide total zinc intake/day. Students sent their completed FFQ to their partner to input the information into the spreadsheet.

Once reference methods were completed, students entered their partners 3DWD & 24HMPR data into Nutritics, a nutrition analysis software combining food composition data from numerous databases, at a supervised workshop. In Nutritics, nutritional information can be found on single items, recipes, branded products and can also be entered directly into the software. Any items missing from Nutritics were replaced and logged on a spreadsheet with the rationale behind the choice of replacement. Once complete, a nutrient intake report was produced on Nutritics.
Once all intake data was collected, students submitted their partners data into a Google Doc and scored the reliability of their partner’s data out of 10. An anonymised spreadsheet of whole class data was then compiled. Participants with a reliability score of <5 for any dietary assessment method were excluded. Data was visually scrutinised, and any implausible data due to assumed input error, was corrected where possible.
Statistical Analysis
Analysis was conducted on Microsoft Excel 2016 and IBM SPSS Statistics software packages. Mean and median values of total daily zinc intake were calculated. After confirming the sample size was below 2000, Shapiro-Wilks normality test was conducted to assess the distribution of data. After determining the distribution, Spearman’s ranked correlation was chosen to establish any associations between methods. Quartile allocations with weighted kappa and Bland-Altman plots were employed to evaluate agreement. Sensitivity and specificity analyses were performed to evaluate the accuracy of the FFQ in determining adequate intake (>RNI). A p-value of 0.05 was used as a cut-off for significance.
Results
Sample & Descriptive Statistics
Two students were excluded for submitting unreliable data and one, who was in duplicate, had one set of their data removed. The 57 remaining subjects (14 male; 43 female) had a mean age of 25 years (range 21-41 years) and mean BMI of 22.9 kg/m2 (range 16-37.8 kg/m2). Table 1 compares the mean and median values of zinc intake from each dietary assessment method.
Table 1. Table comparing daily zinc intake using 3 different dietary assessment tools.
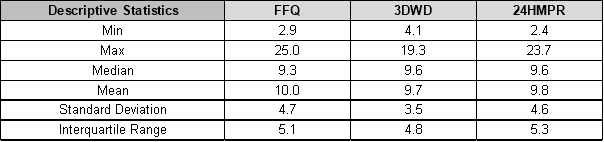
Despite the greater range observed by the FFQ and 24HMPR, similar mean and median intakes were found between assessment methods. The minimal difference between mean and median values suggests normal distribution. Shapiro-Wilks normality test was required to confirm distribution. The 3DWD (P=0.143) accepted the null hypothesis and was normally distributed, whereas the FFQ (P=0.003) and 24HMPR (P=0.008) rejected the null hypothesis and were not normally distributed. As a result, Spearman’s ranked correlation was chosen to evaluate associations between the methods.
Correlation & Association
As shown by the great spread of data in both graphs, Spearman’s ranked correlation revealed no association between the 3DWD and FFQ (Figure 1: correlation coefficient=0.002; p=0.987); or between the 24HMPR and FFQ (Figure 2: correlation coefficient=0.089; p=0.509). These results were, however, not statistically significant.
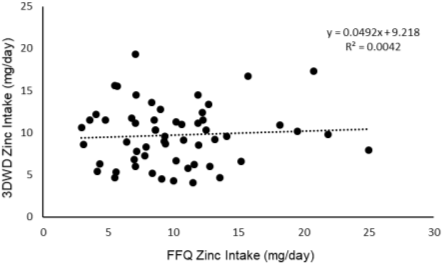
Figure 1. Scatter plot displaying correlation between daily zinc intake measure by 3DWD and FFQ.
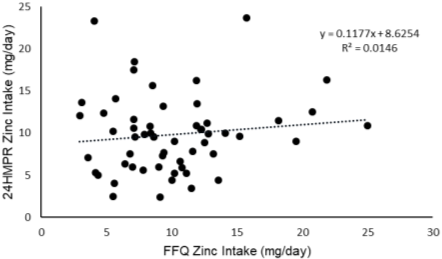
Figure 2. Scatter plot displaying correlation between daily zinc intake measure by 24HMPR and FFQ.
Agreement & Bias
Table 2 displays the percentage of students allocated in the same, adjacent or opposite quartile of zinc intake between methods. The FFQ showed poor agreement with reference methods. Only ~1/4 students were placed in the same quartile and over 10% were grossly misclassified. The low Kappa values, although not statistically significant, emphasise the lack of agreement between methods.
Table 2. Agreement in classifying student zinc intake between different dietary assessment methods.

Bland-Altman analyses reported minimal mean bias between dietary assessment methods (Bias=0.3 in Figure 3; Bias=0.21 in Figure 4) but a positive bias can be seen at higher intakes. When comparing valid methods, 95% of datapoints would be expected to fall within the limits of agreement (Myles et al. 2007). The Bland-Altman indices of 5% & 4% reported in figures 3 and 4 respectively suggest sound agreement between methods for measuring group intake. Nonetheless, the considerable spread of data from the bias in both plots strengthens the evidence indicating a lack of agreement between methods in assessing individual intake.
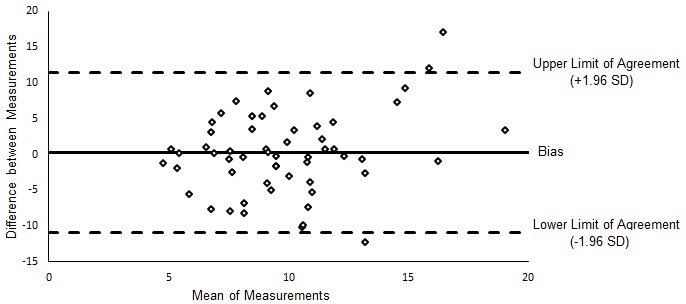
Figure 3. Bland-Altman plot comparing mean difference in zinc intake between the FFQ and 3DWD.
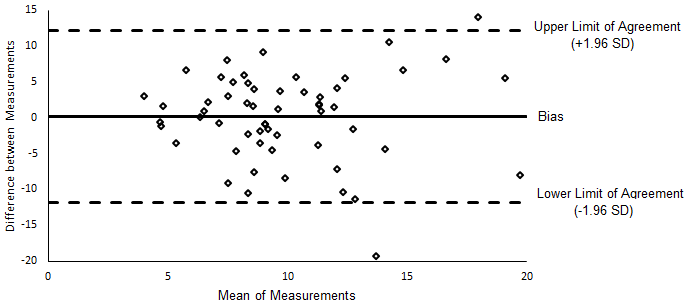
Figure 4. Bland-Altman plot comparing mean difference in zinc intake between the FFQ and 24HMPR.
Determining Adequate Intake
Sensitivity testing was performed to evaluate the accuracy of the FFQ in identifying subjects with zinc intake above the RNI and specificity measured accurate identification of individuals consuming <RNI. As shown in table 3, the sensitivity tests concluded the FFQ performed passably in correctly identifying subjects with zinc intake >RNI. Conversely, specificity testing showed the FFQ poorly identified subjects with intake <RNI.
Table 3. Sensitivity and Specificity analysis comparing the FFQ reference methods.

Discussion
Relative Validity
The FFQ accurately estimated group zinc intake, performing better than comparable FFQs (Alsufiani et al. 2015; Samman et al. 2010), and similarly to another (Głąbska et al. 2018), suggesting it could be an effective tool for assessing zinc intake in populations. Masson et al. (2003) believe a valid FFQ should have a correlation coefficient >0.5; >50% accurate quartile classification; <10% gross misclassification; and a weighted kappa value >0.4. This FFQ fulfilled none of these criteria and consequently, would not be suitable for assessing individual intake. Other FFQs, considered valid, only fulfilled some of these criteria (Alsufiani et al. 2015: 62% correct classification, 2% gross misclassification; Samman et al. 2010: correlation coefficient=0.81). The considerable spread of data from the bias shown in the Bland-Altman plots adds to evidence denouncing the FFQ’s ability to accurately assess individual intake. Positive bias is evident at intake >14mg/day, nonetheless, the overall low bias suggests there are no systematic differences between measurements and affirms the notion that the FFQ would be an effective tool for assessing population zinc intake. By comparison, Głąbska et al. (2018) also reported minimal bias but higher Bland-Altman Indices, whereas Alsufiani et al. (2015) and Samman et al. (2010) detected noticeable negative bias. Sensitivity assessed the FFQ’s ability to correctly identify individuals with zinc intake >RNI and specificity measured accurate identification of individuals consuming <RNI. The FFQ exhibited moderate sensitivity but poor specificity indicating the FFQ may be a useful, but not great, model for identifying individuals with intake >RNI and unsuitable for identifying individuals with intake <RNI (Marôco, 2011). It is important to note that the RNI is only a guide and individual requirements vary. Therefore, intake >RNI does not necessarily signify adequate intake and vice versa.
Strengths and Limitations
Before extrapolating these findings, the participating sample, chosen out of convenience, must be considered. Subjects were predominantly young female adults of healthy weight, not representative of the population. Furthermore, subjects were knowledgeable nutrition students with higher intake than the general population and came from different food sources (Food Standards Agency & Public Health England, 2018). As a result, it was not possible to assess sensitivity and specificity of intake <LRNI which would have been more clinically relevant. Although the diverse range of ethnicities aided representativeness, it made selecting appropriate foods and databases challenging. Greater research in this area beforehand may have improved results. Several students had not resided in the UK for long enough to get accustomed to the UK diet and may have perceived intake (FFQ data) differently from actual intake (3DWD & 24HMPR). Improved agreement may be observed after students had fully settled in the UK. It is unlikely that the two exclusions would have affected results, more could have been excluded (those with modest reliability scores) to improve accuracy, but at the expense of a reduced sample size. It is believed that in validation studies, sample size is unlikely to affect results (Cade, 2004), however, a larger sample is recommended for sensitivity, specificity and Bland-Altman analyses (Bujang & Adnan 2016; Altman 1991) and increased datapoints in quartiles would have improved agreement accuracy and precision (Bland & Altman, 1999).
The FFQ’s design complied with many of Cade’s recommendations (2001), including development of intake frequency; food-list order and grouping; and instruction list; but other recommendations were not adhered to. Completing the FFQ prior to references methods, rather than after, is recommended. The lack of fortified foods and other missing items demonstrates the need for improved food-list research. Food composition databases, including those utilised by Nutritics, can be limited (especially for non-native foods), inaccurate and inconsistent (FAO, 2017). Care should have been taken when handling composition data and computing intake as random errors could easily have arisen. Supplements were considered but excluded from results which may not reflect true intake. Recommendations on food-list length vary and reviews report mixed findings (Serra-Majem et al. 2009), however food-lists longer than the list chosen can be burdensome (Samman et al. 2010). Since FFQ’s rely on memory, assessing intake over only one month may have strengthened the accuracy of the data. (Cade et al. 2001). Despite this, FFQ’s and reference methods should assess diet over an equal time span and consider yearlong diet to reflect habitual intake and seasonality (Serra-Majem et al. 2009). Views are mixed on the best way to approach portion sizing, nevertheless, photographic guides are recommended by experts (Cade, 2001). Contacting subjects to clarify answers and respond to questions was not possible due to time constrains, although utilising closed-ended questions mitigated the need for this. Self-reported data will always be subject to a degree of error and bias (Subar et al. 2015). In this case, the expectation that nutrition students eat healthy may have influenced findings.
Biomarkers were not chosen as a reference method because they are costly, invasive and no association has been found between zinc intake and its concentration in serum (Fayet et al. 2011). 24HMPR is known to correlate well with FFQ’s (Serra-Majem et al. 2009) and 3DWD is the gold standard. Accordingly, both were utilised as reference methods to increase precision and showed similar mean and median zinc and energy intake. The 3DWD was recorded on 3 consecutive days consisting of two weekdays and one weekend day with the aim of considering varying intake throughout the week. Three days was chosen over seven to reduce burden for participants (Shim et al. 2014). Despite this, it is possible that students changed their diet to make weighing easier. The 24HMPR was only conducted once (on a weekday) and by many interviewers, whose interviewer abilities were not assessed. Had more time and funding been available, multiple 24HMPRs could have been conducted at varying intervals by trained interviewers to improve reliability of findings. As few assumptions were made when inputting data into Nutritics, we can assume that most corresponding foods were found in Nutritics. Still, subjects were not trained in using Nutritics which may have increased the degree of data input error. All statistical tests conducted are recommended for validation studies (Cade et al. 2001; Masson et al. 2003) however Bland-Altman plots, which assume normal distribution, were used for nonparametric data. Consequently, their findings should be met with a degree of scepticism (Bland & Altman, 1999). Repeatability should have been investigated to determine whether findings can be reproduced but was not assessed due to time constraints.
Conclusion
The FFQ demonstrated limited validity in assessing zinc intake and would not be a suitable dietary assessment tool for measuring intake in individuals. Despite this, the FFQ could be a useful tool for assessing average intake in populations. Furthermore, the FFQ identified students with adequate intake (>RNI) with modest success. Further analysis will be required to check whether these results are reproducible. Some limitations and improvement suggestions have been identified and should be considered before electing to use the FFQ as a dietary assessment tool for population level or epidemiological studies.
References
- Alsufiani H, Yamani F, Kumosani T, Ford D & Mathers J (2015) The relative validity and repeatability of an FFQ for estimating intake of zinc and its absorption modifiers in young and older Saudi adults. Public Health Nutrition 18: 968-976
- Altman DG (1991) Practical Statistics for Medical Research. London: Chapman and Hall, pp. 1-624
- Bland JM & Altman DG (1999) Measuring agreement in method comparison studies. Statistical Methods in Medical Research 8: 135-160
- Brown KH, Wuehler SE & Peerson JM (2001) The Importance of Zinc in Human Nutrition and Estimation of the Global Prevalence of Zinc Deficiency. Food and Nutrition Bulletin 22: 113-125
- Bujang MA, & Adnan TH (2016) Requirements for Minimum Sample Size for Sensitivity and Specificity Analysis. Journal of clinical and diagnostic research 10: YE01-YE06
- Cade JE, Warthon-Medina M, Albar S, Alwan NA, Ness A, Roe M, Wark PA, Greathead K, Burley VJ, Finglas P, Johnson L, Page P, Roberts K, Steer T, Hooson J, Greenwood DC & Robinson S (2017) DIET@NET: Best Practice Guidelines for dietary assessment in health research. BMC medicine 15: 202-217
- Cade JE, Thompson R, Burley V & Warm D (2001) Development, validation and utilisation of food-frequency questionnaires – a review. Public Health Nutrition 5: 567-587
- Cade JE, Burley VJ, Warm DL, Thompson RL & Margetts BM (2004) Food-frequency questionnaires: a review of their design, validation and utilization. Nutrition Research Reviews 17: 5-22
- Fayet F, Flood V, Petocz P & Samman S (2011) Relative and biomarker-based validity of a food frequency questionnaire that measures the intakes of vitamin B(12), folate, iron, and zinc in young women. Nutrition Research 31: 14-20
- Food Standards Agency & Public Health England (2018) National Diet and Nutrition Survey (NDNS) results from years 7 and 8 (combined): data tables [online] Available at: https://www.gov.uk/government/statistics/ndns-results-from-years-7-and-8-combined (Accessed 23 December 2018)
- Freedman LS, Midthune D, Arab L, Prentice RL, Subar AF, Willett W, Neuhouser ML, Tinker LF & Kipnis V (2018) Combining a Food Frequency Questionnaire With 24-Hour Recalls to Increase the Precision of Estimation of Usual Dietary Intakes—Evidence From the Validation Studies Pooling Project. American Journal of Epidemiology 187: 2227-2232
- Food and Agriculture Organization of the United Nations (FAO) (2017) International Network of Food Data Systems (INFOODS): Food composition challenges [online] Available at: http://www.fao.org/infoods/infoods/food-composition-challenges/en/ (Accessed 31 December 2018)
- Głąbska D, Staniec A, & Guzek D (2018) Assessment of Validity and Reproducibility of the Zinc-Specific Dietary Intake Questionnaire Conducted for Young Polish Female Respondents. Nutrients 10: 104-119
- Hollis JL, Craig LCA, Whybrow S, Clark H, Kyle JAM & McNeill G (2016) Assessing the relative validity of the Scottish Collaborative Group FFQ for measuring dietary intake in adults. Public Health Nutrition 20: 449-455
- Kyle UG MS RD/LD & Coss-Bu JA MD (2010) Nutritional assessment and length of hospital stay. Canadian Medical Association Journal 182: 1831-1832
- Marôco J (2011) Análise Estatística com o SPSS Statistics (7ª Edição) Pêro Pinheiro: ReportNumber, pp. 1013
- Masson LF, McNeill G, Tomany JO, Simpson JA, Peace HS, Wei L & Bolton-Smith C (2003) Statistical approaches for assessing the relative validity of a food-frequency questionnaire, use of correlation coefficients and the kappa statistic. Public Health Nutrition 6: 313-321
- Naska A, Lagiou A & Lagiou P (2018) Dietary assessment methods in epidemiological research: current state of the art and future prospects. F1000Research 6: 926-934
- National Health Service (NHS) (2017) Vitamins and Minerals: Zinc [online] Available at: https://www.nhs.uk/conditions/vitamins-and-minerals/others/ (Accessed 21 December 2018)
- Nutritics Nutritional Analysis Software: Education v5.09 [online] Available at: https://www.nutritics.com/app/#
- Ortega RM, Pérez-Rodrigo C & López-Sobaler AM (2015) Dietary assessment methods: dietary records. Nutrición Hospitalaria 31: 38-45
- Public Health England (2015) GOV.UK: McCance and Widdowson’s composition of foods integrated dataset [online] Available at: https://www.gov.uk/government/publications/composition-of-foods-integrated-dataset-cofid
- Roohani N, Hurrell R, Kelishadi R & Schulin R (2013) Zinc and its importance for human health: An integrative review. Journal of Research in Medical Sciences 18: 144-57
- Samman S, Herbert J, Petocz P & Lyons-Wall PM (2009) Development and Validation of a Short Questionnaire for Estimating the Intake of Zinc. Biological Trace Element Research 134: 226 – 234
- Sauvageot N, Alkerwi A, Adelin A & Guillaume M (2013) Validation of the Food Frequency Questionnaire Used to Assess the Association between Dietary Habits and Cardiovascular Risk Factors in the NESCAV Study. Journal of Nutrition & Food Sciences 3: 1-8
- Serra-Majem L, Pfrimer K, Doreste-Alonso J, Ribas-Barba L, Sánchez-Villegas A, Ortiz-Andrellucchi A & Henríquez-Sánchez P (2009) Dietary assessment methods for intakes of iron, calcium, selenium, zinc and iodine. British Journal of Nutrition 102: S38-S55
- Shim JS, Oh K & Kim HC (2014) Dietary assessment methods in epidemiologic studies. Epidemiology and Health 36: 1-8
- Subar AF, Freedman LS, Tooze JA, Kirkpatrick SI, Boushey C, Neuhouser ML, Thompson FE, Potischman N, Guenther PM, Tarasuk V, Reedy J & Krebs-Smith SM (2015) Addressing Current Criticism Regarding the Value of Self-Report Dietary Data. Journal of Nutrition 145: 2639-2645
- World Health Organisation (WHO) (2018) Benefits of a balanced diet [online] Available at: http://www.euro.who.int/en/health-topics/disease-prevention/nutrition/a-healthy-lifestyle/benefits-of-a-balanced-diet (Accessed 18 December 2018)
Cite This Work
To export a reference to this article please select a referencing stye below:
Related Services
View all


DMCA / Removal Request
If you are the original writer of this essay and no longer wish to have your work published on UKEssays.com then please click the following link to email our support team:
Request essay removal