Creep Behaviour of Materials
| ✅ Paper Type: Free Essay | ✅ Subject: Physics |
| ✅ Wordcount: 2063 words | ✅ Published: 30 Jan 2018 |
Chen Yi Ling
-
Objectives
The objectives of the experiment are:
- To measure the creep deformation in lead and polypropylene at room temperature
- To determine the effect of stress on the creep deformation of lead and polypropylene
- To appreciate the difference in creep behaviour between these two classes of materials
- To be aware of creep as a design consideration
-
Theory
2.1. Introduction
Deformation under a certain applied load over a period of time at a particular temperature is defined as creep, and it limits the load carrying capacity among structual materials.
When subjected to a stress greater or equal to its yield stress, the material deforms plastically. Alternately, when the stress is less than its yield stress, the material will deform elastically.
However, when the material has to withstand stress at high temperature, permanent deformation will occur even if the stress is below the yield stress obtained from a tensile test. Under a constant stress, the strain vary as a function of time as shown in Figure 2.1.1. [1]

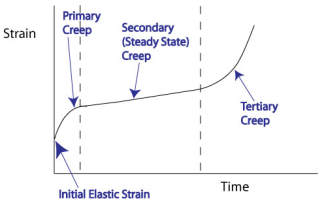
The different stages of creep are:
Primary Creep/Transient Creep
- Strain rate decreases with time and deformation becomes difficult as strain increases. (i.e. Strain Hardening)
Secondary Creep/Steady Creep
- Strain rate is constant
- The occurrence is due to the balance between strain hardening and strain softening (Structure Recovery)
Tertiary Creep/Approaching Rupture
- Strain rate increases with time and the material is fractured.
- Increase in creep rate is due to the increasing number of damages such as cavities, cracks and necking.
- The damaging phenomena reduce the cross-sectional area, which increase the applied stress when placed under constant load.
Viscoelastic materials such as polymers and metals are susceptible to creep. When subjected to a sudden force, the response of a polymeric material can be detected using the Kelvin-Voigt model (Figure 2.1.2)


Viscoelastic materials experience an increase in strain with time when subjected to a constant stress, this is termed as viscoelastic creep. At t0 (Figure 2.1.3), viscoelastic material is able to maintain for a significant long period of time when loaded with a constant stress. The material eventually fails when it responds to the stress with an increasing strain. In contrast, when the stress is maintained for a shorter period of time, the material experience an initial strain until t1 in which the stress is relieved. The strain then immediately decrease gradually to a residual strain. [3]


In this experiment, we will study the creep behaviour of a low-melting point metal (Lead, Pb) and a polymer (Polypropylene, PP) at room temperature.
2.2. Creep in Metals
Creep can be observed in all metals if its operating temperature exceeds 0.3 to 0.5Tm [5] (Tm = Absolute Melting Temperature) (Figure 2.2.1)

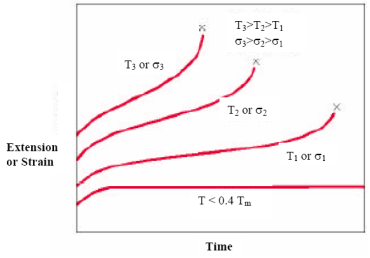
Creep strain (ε) depends on several variables, the most important variables are stress (σ) and temperature (T). Using stress and temperature, the creep rate ( ) can be defined as:
 ——————– (Equation 2.2.1)
Where,
A = Constant
n = Stress Exponent
E = Activation energy for creep
R = Universal gas constant
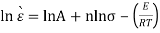
Creep rate () increase as stress and temperature increase, hence Equation 2.2.1 can be redefined as:
 ——————– (Equation 2.2.2)
Whereby n is the slope of  vs lnA at constant temperature.
2.3. Creep in Polymers

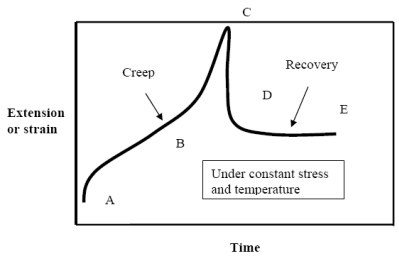
The creep in polymers is almost similar to the creep in metal as it is depends on stress and temperature, with a few exceptions. Comparing Figure 2.2.1 and Figure 2.3.1, the two graphs look similar except that Figure 2.3.1 has a recovery phase, which is termed as the reversal of creep.
Possessing viscoelastic properties, the behavior of the material can be predicted using the Kelvin-Voigt model (Figure 2.1.2) as mentioned earlier, and hence, it will be used in this experiment.
Equation 2.3.1 shows the relationship between the creep strain (ε) and time under constant stress:
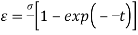 ——————– (Equation 2.3.1)
Where  and
and  are the constant of the spring and dashpot respectively (Figure 2.1.2)
On the other hand, Equation 2.3.2 shows the creep strain in relation to time:
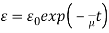 ——————– (Equation 2.3.2)
Where  is a constant.
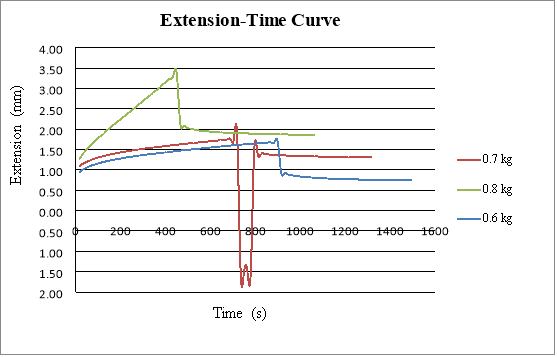
The data obtained can be plotted into an isochronous graph by taking the constant time section through the creep curves for a specific temperature. And the results obtained formed the isochronous graph.
- Experimental Procedures
3.1 Equipment for Creep Testing


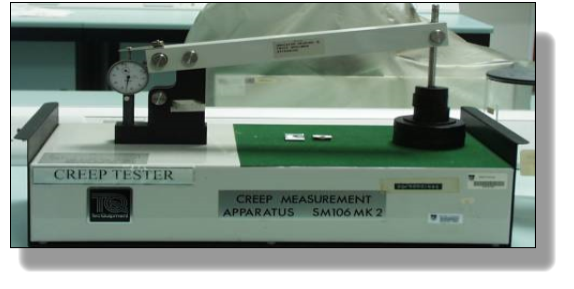
The load was applied steadily to the specimen using the lever principle shown in Figure 3.1.1. Steel pins were used to kept the specimen in place on one side of the lever and the weight hanger on the other.
The weight hanger consist of 2 pinning position; the topmost hole was used when the hanger and loads were in rest position while the lower hole was used when the hanger was loaded.
The following table shows the mass for the parts of the equipment which should be taken into consideration during the calculation of tensile force on the specimen
|
Parts |
Mass (kg) |
|
Lever Arm |
0.4 |
|
Weight Hanger |
0.16 |
|
Pins |
0.04 each |
If m was the mass of the load on the weight hanger, then the tensile force acting on the specimen can be defined by taking moment about pivot as shown in Figure 3.1.2.

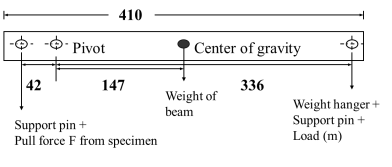
[(F+0.04) x 42] – [0.40 x 147] – [(0.16 + 0.04 +m) x 336] = 0
 ————— (Equation 3.1.1)
Where, g is the acceleration due to gravity = 9.807m/s2
The extension of the specimen was measured using a dial gauge (DG). The DG was placed into a tube tightened using a nylon pinch screw to hold the DG in its place. It should be noted that the nylon pinch screw should only be tighten sufficiently to prevent the DG from moving when the loads were placed.
The top of the DG was attached to the set up using a grooved plate which was bolted to the lever arm. This arrangement was to ensure the groove in this plate was two times the distance from the pivot to the centre of the specimen. Hence, the extension of the specimen detected by the DG was twice the actual extension of the specimen. And to counter for inaccuracy when zeroing the DG, an additional 3mm was taken into account before the start of the experiment.
Thus, the actual extension of the specimen can be calculated by:
 ————— (Equation 3.1.2)
3.2 Experiment Methods
For the measurement of creep in lead, the load applied would be 0.9, 1.0 and 1.1kg. For the measurement of creep in polypropylene, the load applied would be 0.7, 0.8 and 0.9kg.
Before conducting the experiment, the width, length, thickness and gauge length of the specimen was measured thrice using an electronic vernier caliper; the readings used for the calculation would be the average reading (highlighted in orange).
|
Lead |
||||
|
Load (kg) |
Width (mm) |
Length (mm) |
Thickness (mm) |
Gauge Length (mm) |
|
0.9 |
4.92 |
89.64 |
1.75 |
20.09 |
|
4.91 |
89.43 |
1.74 |
19.52 |
|
|
4.88 |
89.53 |
1.74 |
19.99 |
|
|
4.903 |
89.533 |
1.743 |
18.867 |
|
|
1.0 |
4.91 |
89.46 |
1.73 |
20.83 |
|
4.93 |
89.46 |
1.76 |
20.78 |
|
|
4.84 |
89.49 |
1.74 |
20.66 |
|
|
4.893 |
89.47 |
1.743 |
20.757 |
|
|
1.1 |
4.82 |
89.19 |
1.72 |
22.21 |
|
4.81 |
89.04 |
1.76 |
22.70 |
|
|
4.83 |
89.24 |
1.71 |
22.75 |
|
|
4.82 |
89.157 |
1.73 |
22.553 |
|

|
Polypropylene |
||||
|
Load (kg) |
Width (mm) |
Length (mm) |
Thickness (mm) |
Gauge Length (mm) |
|
0.6 |
4.78 |
89.04 |
0.88 |
21.28 |
|
0.7 |
4.77 |
89.30 |
0.93 |
19.13 |
|
0.8 |
4.91 |
89.02 |
0.90 |
21.50 |

3.2.1 Experiment 1: Creep of Lead
- The lever arm was held in place using 2 pins; 1 of it to be inserted into the bearing block and the other onto the topmost hole of the weight hanger.
- Attached the specimen onto the set up using 2 pins.
- Place the Dial Gauge into the hole/tube but do not tighten the nylon screw yet.
- Attach the groove plate at the top of the Dial Gauge and lever arm and secure it using a thumb nut.
- Release the pin holding the weight hanger to take up any free movement.
- Make sure the specimen was placed vertically.
- Carefully adjust the Dial Gauge until the inner dial reads 3mm and the outer ring reads 0, then tighten the nylon screw.
- Load the required weight onto the hanger.
- Raise the loaded weight hanger to the lower hole (loading position) and insert the pin.
- Gently release the load and start stop watch.
- Record reading every 15 seconds for 30 minutes or till the specimen ruptures.
In order to determine the secondary creep rate for each applied stress, 3 extension-time creep curves were required. The creep rate can be calculated using the following equation:
 ————— (Equation 3.2.1.1)
Where 


In this experiment, ln vs ln plot was required. Hence, the stress (
 ) on the specimen is given by:
 ————— (Equation 3.2.1.2)
Where, F is the load applied to the specimen (N)
3.2.2 Experiment 2: Creep of Polypropylene
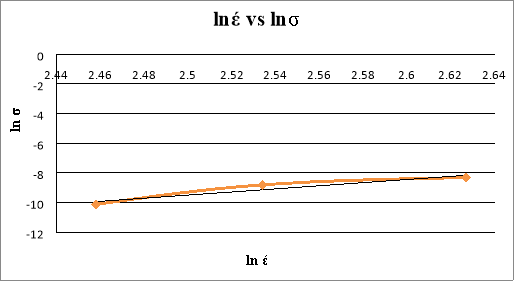
The test of creep of polypropylene is similar to that of lead, with a couple of exceptions. Before placing the specimen onto the set up, 2 ‘U’ brackets should be fitted over the 2 ends of the specimen. For polypropylene, elastic recovery was possible hence the specimen was not required to be tested until failure. Note that 15 minutes, 12 minutes and 7 minutes were the extension time required for 0.6kg, 0.7kg and 0.8kg respectively
- Place the required load onto the weight hanger.
- Record the extension for every 15 seconds for specific duration.
- After the extension period, remove the weights on the weight hanger and continue to record the reading (elastic recovery phase) every 15 seconds for 10 minutes or when the needle on the Dial Gauge stop moving for 1 minute.
- Repeat for other loads.
- Plot extension vs time curve to show the creep and recovery curve.
In this experiment, strain vs stress plot was required. Hence, the strain rate ( ) on the specimen is given by:
 ————— (Equation 3.2.2.1)
Where
- Results
- Results for Lead

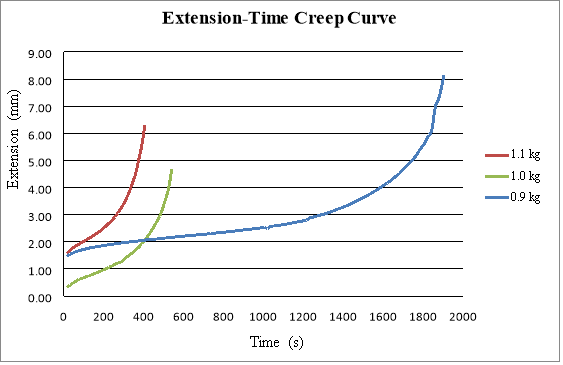
The increment of extension ( ) was selected based on the results reflected on Figure 4.1.1.
The creep rate (Î) of Lead was determine using Equation 3.2.1.1.
|
Load (kg) |
[l2 – l1] |
|
|
Creep Rate, |
|
0.9 |
|
19.87 |
|
|
|
1.0 |
|
20.76 |
|
|
|
1.1 |
|
22.55 |
|
|


 (s-1)
(s-1)


The stress ( ) applied onto the lead specimen was calculated using Equation 3.2.1.2.
|
Load, kg |
Applied Load, F (N) |
Area, A (mm2) |
Stress, |
|
0.9 |
99.639 |
8.526 |
11.686 |
|
1.0 |
107.484 |
8.525 |
12.608 |
|
1.1 |
115.330 |
8.339 |
13.830 |
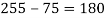
By adding ln to the values of and Î,
|
Load, kg |
ln |
lnÎ |
|
0.9 |
2.458 |
-10.119 |
|
1.0 |
2.534 |
-8.798 |
|
1.1 |
2.627 |
-8.310 |


Using the data from Table 4.1.1, we can plot a linear graph.

Based on Figure 4.1.2, the stress exponent (n) from the straight line was 10.503.
- Results for Polypropylene

A sudden drop was observed for 0.7kg, this was due to human error as results was not recorded promptly on specific time.
Using Equation 3.2.1.2 & 3.2.2.1, the stress and strain rate is shown below:
|
Load |
Width (mm) |
Thickness (mm) |
Area, A (mm2) |
Applied Load, F (N) |
Stress, |
|
0.6 |
4.78 |
0.88 |
4.206 |
76.102 |
18.094 |
|
0.7 |
4.77 |
0.93 |
4.436 |
83.948 |
18.924 |
|
0.8 |
4.91 |
0.90 |
4.419 |
91.794 |
20.773 |
|
Load, kg |
|
Extension (mm) |
Strain Rate, |
||||
|
45s |
240s |
405s |
45s |
240s |
405s |
||
|
0.6 |
21.28 |
1.04 |
1.32 |
1.44 |
0.049 |
0.062 |
0.068 |
|
0.7 |
19.13 |
1.19 |
1.47 |
1.59 |
0.062 |
0.077 |
0.083 |
|
0.8 |
21.50 |
1.49 |
2.42 |
3.17 |
0.069 |
0.113 |
0.147 |

|
Load, kg |
Stress, |
Strain Rate, |
||
|
45s |
240s |
405s |
||
|
0.6 |
18.094 |
0.049 |
0.062 |
0.068 |
|
0.7 |
18.924 |
0.062 |
0.077 |
0.083 |
|
0.8 |
20.773 |
0.069 |
0.113 |
0.147 |


Based on Figure 4.2.1, when stress is constant, the strain increases as time increases, which tallies with the theory.
5. Discussion
-
- Usefulness of the Plot of lnσ vs lnÎ
By plotting lnσ against lnÎ, we can determine the gradient (n) or the stress exponent of the specimen, which correspond to the controlling mechanism of creep under testing conditions.
- Stress Exponent for Lead
The stress exponent indicates the influence of deformation rate on the mechanical strength of the specimen.[7]
At low stresses, n equals to 1, which indicates pure diffusion creep. At high stresses, n > 1, indicating other creeping mechanism besides pure diffusion.
- Factors affecting the stress exponent value
The stress exponent for lead in this experiment was found out to be 10.503. And the factors which affects the value is the type of creeping mechanism behind the specimen.
Some creeping mechanisms include Coble creep (Grain boundary diffusion) and Dislocation creep/climb (Power law creep).[8]
- Creep of Metals in Design Consideration
The following are some methods to minimize creeping in metals:
- Employ materials with high Tm
- Reduce the effect of grain boundaries by using a single crystal with large grains or adding solid solutions to eliminate vacancies[9]
Creep is an important consideration for when a component have to support a load at temperatures where Tabs/TM > 0.4.[10]
For high temperature, creep is an important consideration in these three areas:
- Displacement-limited applications such as turbine rotors in jet engines
- Rupture-limited applications such as high pressure steam pipes
- Stress Relaxation limited applications such as tightened bolts and suspended cables [11]
- Viscoelastic Behaviour
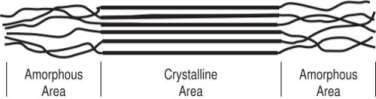
Materials which exhibits both viscous and elastic property during deformation is known as viscoelasticity.[12] In this experiment, both lead and polypropylene exhibits viscoelasticity to different extend. For lead, the time taken in which the specimen rupture decreases as the stress increases. However, its viscoelasticity is not high hence, its recovery phase is not as significant as polypropylene. Furthermore, the structure of lead is more crystalline than polypropylene, which means it is more brittle and more prone to rupture.
For polypropylene, the extension increases as the stress increases. The extension and recovery rate of each load are as follow:
|
Load (kg) |
Extension (%) |
Recovery (%) |
|
0.6 |
44.9 |
22.1 |
|
0.7 |
38.9 |
Not applicable due to experimental error |
|
0.8 |
63.0 |
15.5 |

Recovery rate is possible on polypropylene specimen because it has higher elasticity due to its amorphous structure. The amorphous structure untangles and lengthens out until it becomes crystalline.

- Conclusion
In conclusion, the results obtained from the experiment is true to theory. Unfortunately, during the creep test for lead, some results are missing due to some human error resulting in an incomplete graph as depicted in Figure 4.2.1.
For the creep in lead, load 1.0kg and 1.1kg rupture before 30 minutes. This shows that the heavier the load, the faster the creep rate. At even high temperature, t
Cite This Work
To export a reference to this article please select a referencing stye below:
Related Services
View all


DMCA / Removal Request
If you are the original writer of this essay and no longer wish to have your work published on UKEssays.com then please click the following link to email our support team:
Request essay removal