Experiment to Examine the Relationship between Voltage, Current and Resistance
| ✅ Paper Type: Free Essay | ✅ Subject: Physics |
| ✅ Wordcount: 1244 words | ✅ Published: 03 Nov 2020 |
BACKGROUND
Electricity is a form of energy that can be carried by wires and is used for heating and lighting, and to provide power for machines (Collins Dictionary, 2020). In this experiment the electricity was sourced from a power pack which is a transformer used for converting an alternating current (from the mains) to a direct current at a different (usually lower) voltage.
In this experiment, to conduct the electric flow and current, a conductor was used in an attempt to limit the resistance which is the hindrance to the flow of electrons in material (Electronic Notes, 2020). This was achieved using a resistor which is an electrical component that regulates or limits the flow of electrical current in an electronic circuit. If a specific voltage is required for an active device, for example, a transistor, a resistor can be used (Rouse, 2014).
Electrons travel in zigzag patterns through wires or other external circuits which results in a collision between the electrons and the ions in the conductor, and this process is known as resistance.
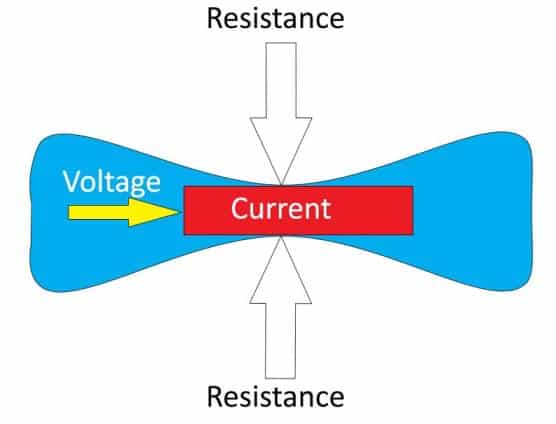
George Ohm observed that the difference of a circuit directly relates to the current flowing throughout a circuit, and that a circuit sometimes resists the flow of electricity. Ohm created a rule for working out resistance, shown in the image below:

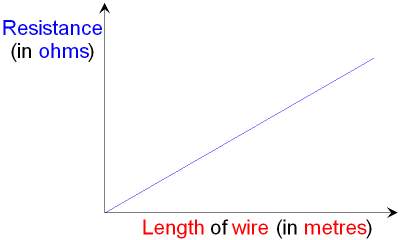
Resistance is an important element that has been utilised in many forms of technology to perform useful functions, and this experiment looked at how it could be controlled. There are four factors of a wire that impact on the resistance of a wire; material, temperature, diameter and length. This experiment focussed specifically on the last factor – length – to investigate how much the length of a wire effected its electrical resistance, using a range of wire lengths to test with.

AIM
To practically examine the relationship between voltage, current and resistance.
HYPOTHESIS
It was predicted that that the length of the wire would determine the level of resistance (i.e., the longer the wire, the larger the resistance). This is due to the free electrons in the wire bumping into more atoms, making it more difficult for electricity to flow. According to this theory, the graph shows a positive correlation.
VARIABLES
There were a number of variables that could be altered in this experiment; these are known as independent variables. For this experiment the only independent variable was the length of the wire. The controlled variable was the powerpack as the voltage through the wire was controlled. Resistance was the dependent variable in this experiment.
To maintain accuracy a record of the voltage and the current was taken three times every 20cm and the average reading recorded. This served to void any anomalous results and eliminate the chance of false readings. The powerpack was switched off in between each reading to ensure that the wire did not heat up too much.
Power pack- controlled variable
Length- Independent
Resistance- Dependent
MATERIALS
- Power pack
- Leads with alligator clips
- 1.1m Nichrome wire (Resistor)
- Voltmeter
- Light bulbs
- Ammeter
- Switch
- Heatproof mat
- 10, 15 or 56- ohm resistor
 1m ruler
- Electrical tape
METHOD
- Collected materials
- Set up the ruler by taping a wire along it
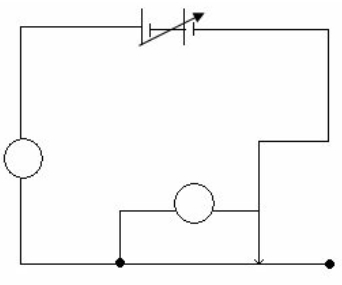
- Connected the wires to the Voltmeter, Ammeter and Power pack
- Tested the current and voltage by moving the wires with alligator clips down the wire – tested at 100cm, 80cm, 60cm, 40cm and 20cm
- Measured each 20cm x 3 times and turned the power on and off between each trial
- Recorded results in table (Figure 3)
Figure 1: Apparatus
SAFETY MEASURES
| RISK | PRECAUTION |
| Electrocution |
|
| Injury to Feet from Falling Objects |
|
| Hair Catching on Fire From Sparks |
|
| Burns to Eyes |
|
| Burns to Hands |
|
RESULTS
The results in the graph below (Figure 2) represent a nearly straight line, indicating a strong positive correlation between length and resistance, which was consistent with the prediction.
Figure 2:
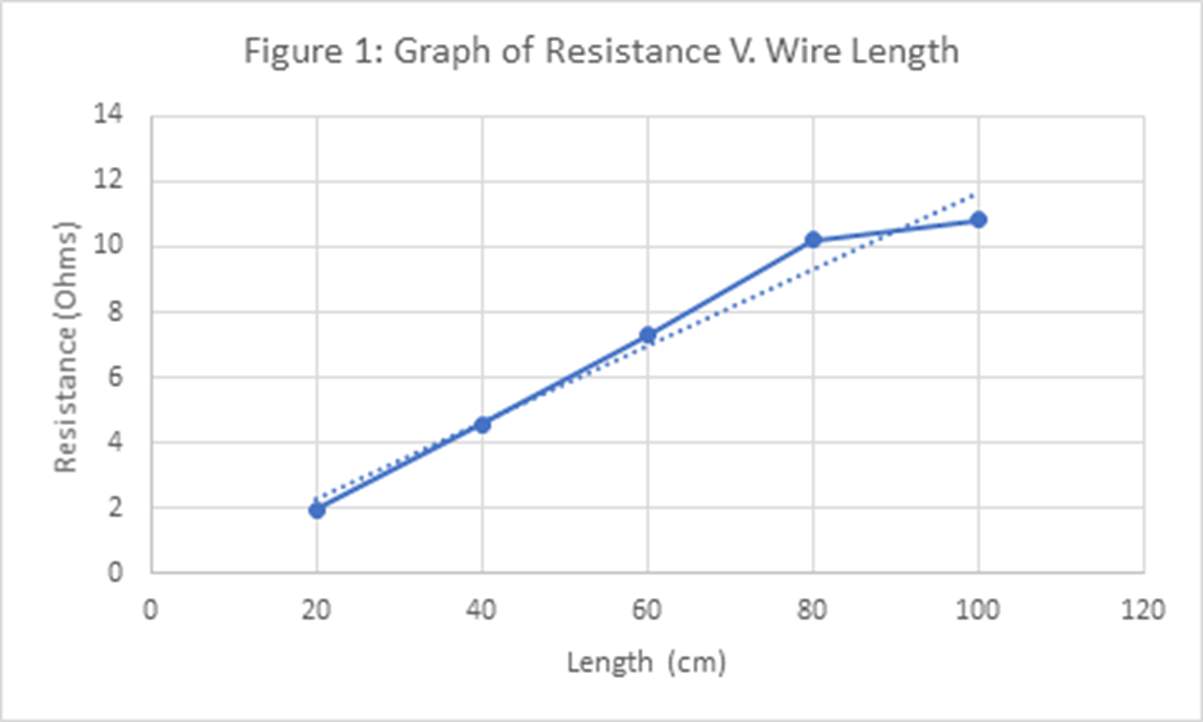
Figure 3:
Results
| Length of Nichrome Wire (cm) | Trial results for voltage (V) | Average Results for Voltage (V) | Trial results for current (A) | Average results for current (A) | Resistance (Ohms) | ||||
| Trial 1 | Trial 2 | Trial 3 | Trial 1 | Trial 2 | Trial 3 | ||||
| 100 | 1.3 | 1.3 | 1.3 | 1.3 | 0.11 | 0.12 | 0.12 | 0.12 | 10.83 |
| 80 | 1.3 | 1.5 | 1.5 | 1.43 | 0.14 | 0.14 | 0.14 | 0.14 | 10.21 |
| 60 | 1.5 | 1.2 | 1.25 | 1.32 | 0.17 | 0.18 | 0.18 | 0.18 | 7.3 |
| 40 | 1.1 | 1.1 | 1.1 | 1.1 | 0.24 | 0.24 | 0.24 | 0.24 | 4.58 |
| 20 | 0.7 | 0.7 | 0.7 | 0.7 | 0.36 | 0.37 | 0.36 | 0.36 | 1.94 |
DISCUSSION
The results showed that as the length of the wire increased, so did the resistance. Furthermore, it suggested that if the length of the wire was doubled, resistance was roughly doubled also e.g. when the length of the wire was 20cm the resistance was 1.94 ohms; when the length of the wire was 40cm the resistance was 4.58 ohms, which is roughly double.
The apparatus used was suitable, however, increasing the number of data readings to achieve more reliable results may have been beneficial, perhaps by increasing the length of the wire by 10cm each time, instead of by 20cm.
Gradient – m= rise/run
= (y2 – y1) / (x2– x1)
= (10. 21- 7.3) / (80 – 60)
= 2.91/20
=0.15
Evaluation
Overall, the results were consistent with the predictions. There was one reading that veered away from the straight line, but all others were consistent with the general trend. A kink in the wire could have led to this inconsistent reading as it would have prevented a particular part of the wire remaining constant, therefore skewing the result.
The range of results were substantial enough to draw a valid conclusion about how the length of the wire affected the resistance. Figure 2 represents this conclusion.
It is reasonable to predict that the pattern would continue beyond the range of values that were used. Having said that, without specialist equipment the results could potentially be distorted due to the wire overheating and classroom environment not being suitable to increase the length of the wire due to safety concerns and space constraints.
CONCLUSION
The graph in Figure 2 represents an increasing linear trend-line with the mathematical function of Y = 6.9065X + 21.137, showing a positive correlation as seen in the line that goes above and to the right, indicating positive values, as well as the gradient that displays a positive value.
The steady incline proves that when the length of a wire is increased, the resistance responds with an increase also of approximately 3 Ω. This information is consistent with the data provided in Figure 3.
The length of the wires (independent variable) ranged from 20cm to 100cm with increments of 20cm between each trial, while the resistance (dependent variable) data ranged from 1.94 Ω at its lowest to 10.38 Ω at its highest measure. This data is best understood using a line graph (Figure 2).
The pattern shown on the graph supports the hypothesis of the experiment, proving that, when the length of the wire was increased, the resistance measured increased accordingly, resulting in a positive gradient. This was proven and supported by the trend-line in the graph which depicts a positive correlation in the increase in resistance in the same measure as the independent variable increases. The graph also resulted in a positive mathematical function of Y = 6.9065X + 21.137.
In conclusion, the experiment was an adequate investigation that successfully answered the research question of how changing the length of a wire could affect the electrical resistance generated within the wires.
Bibliography
- Collins Dictionary. (2020). Retrieved Febuary 24, 2020, from https://www.collinsdictionary.com/dictionary/english/electricity
- Electronic Notes. (2020, Febuary 26). What is Resistance? Electrical Resistance. Retrieved Febuary 26, 2020, from Electronic Notes: https://www.electronics-notes.com/articles/basic_concepts/resistance/what-is-resistance.php
- Rouse, M. (2014, Febuary 25). TechTarget. Retrieved Febuary 26, 2020, from Resistor: https://whatis.techtarget.com/definition/resistor
Cite This Work
To export a reference to this article please select a referencing stye below:
Related Services
View all


DMCA / Removal Request
If you are the original writer of this essay and no longer wish to have your work published on UKEssays.com then please click the following link to email our support team:
Request essay removal