Lift of a Flat Surface in Wind
| ✅ Paper Type: Free Essay | ✅ Subject: Physics |
| ✅ Wordcount: 2435 words | ✅ Published: 11 Sep 2017 |
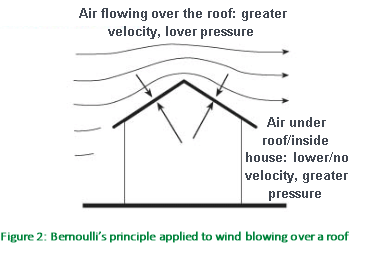
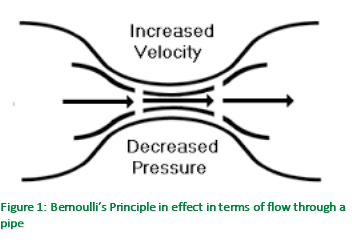
When working with lift, there are several concepts[AR2]that need to be considered, most prominently Bernoulli’s Principle. This principle, named for its creator Daniel Bernoulli, states that “when an incompressible, smoothly flowing fluid gains speed, internal pressure in the fluid decreases, and vice versa.” (Hewitt, 2004) Put simply in terms of aerodynamics, Bernoulli states that when a fluid’s speed increases, the pressure perpendicular to the flow of the fluid is decreased. For example, the Bernoulli Effect can be clearly observed in terms of a plane in flight. Planes are able to fly [ar3]because their wings are designed to cause air to flow faster over the top than the bottom. This creates lower are pressure above the wing, and the greater pressure below the wing “pushes” the plane up. This upward pressure is referred to as lift force, or simply lift. (Actforlibraries.org, 2017) [ar4]
Lift is generated by deflecting airflow. By taking Newton’s second law of motion ( ), it can be stated that the aerodynamic forces on a body with 0 drag [ar5]relate directly to the change in momentum of the fluid, which is equal to mass
  velocity of the fluid. (Hall, 2015) An object’s lift capabilities can be measured using the equation:

Where  =density,
  =velocity,
  =surface area and
 =Coefficient of Lift. (Hodanbosi, 1996)
Lift is dependent on velocity, air density, air viscosity/compressibility, the shape of the body and the body’s inclination in relation to the airflow. The velocity variable in the equation is , therefore doubling the velocity will quadruple the lift etc. Additionally, dependence on shape, viscosity/compressibility and inclination is complex; to deal with these they are characterized as a single variable, known as the coefficient of lift. (Hall, 2015) The lift coefficient, used to model the complex dependencies on lift, can be obtained using the equation:

Where  lift,
lift,  the dynamic pressure (
 )
)
and  surface area.
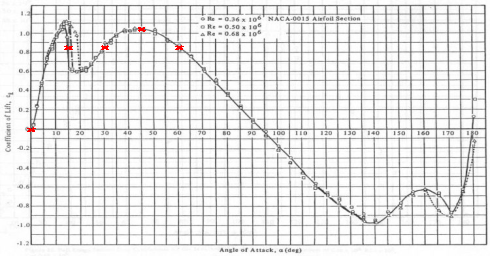
Therefor, expresses the ratio of lift force to dynamic pressure times surface area. (Hall, 2015) It is most often found experimentally, however the values for this experiment have been taken from Aerospaceweb.com. (Jeff, 2003) Also, by using an International Standard Atmosphere (ISA) table, the air density variable for this experiment shall be assumed to be 0.9337kgm3, based on an assumed altitude of approx. 691m above sea level. (Cavcar, N/A)
Lift is dependent of several variables, including inclination. The angle between a surface and the airflow is referred to as the angle of attack. The angle of attack has a strong effect on the lift being produced. In terms of an airplane: when an airplane is preparing to take off, it accelerates swiftly to reach the required velocity. However, just before lifting off, the pilot tilts the wings, creating a greater angle of attack and giving the airplane the required lift to leave the ground. In terms of surfaces such as thin aerofoils and roofs, the coefficient of lift is directly proportional to the angle of attack, when the angle is within +/- 10°. For larger angles, the dependence becomes quite complex and is therefore defined by a coefficient of lift. (Hall, 2015)
By using the above lift equation, theoretical equations can be created to assist in the analysis of the outcome of the experiment, for example:
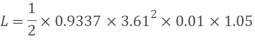

Where  3.61ms-1 (calculated using the iOS app “Wind Meter”),
the area of one of the roof pieces
and  the corresponding coefficient of lift[AR6].


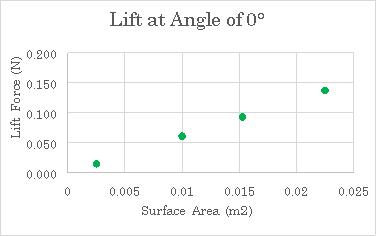
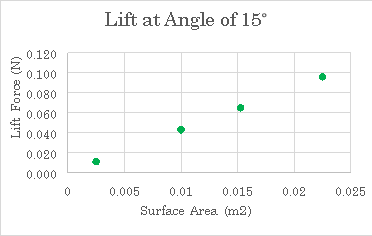
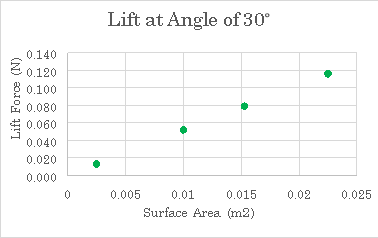
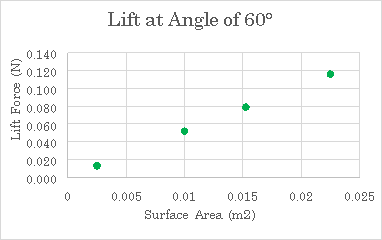
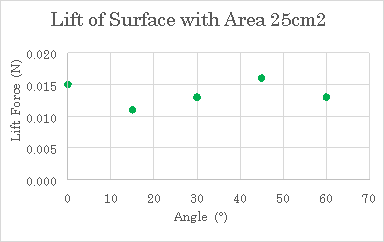
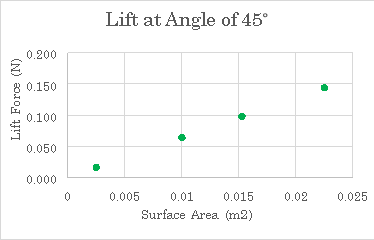
Below are the full results of the theoretical calculations performed for this experiment:
|
Lift Applied to Roofs of Different Areas and Inclinations |
||||
|
0.0025m2 |
0.01 m2 |
0.015265 m2 |
0.0225 m2 |
|
|
0° |
0.015N |
0.061N |
0.093N |
0.137N |
|
15° |
0.011N |
0.043N |
0.065N |
0.096N |
|
30° |
0.013N |
0.052N |
0.079N |
0.116N |
|
45° |
0.016N |
0.064N |
0.098N |
0.144N |
|
60° |
0.013N |
0.052N |
0.079N |
0.116N |
Table 1 (created using[JB7] MS Excel)
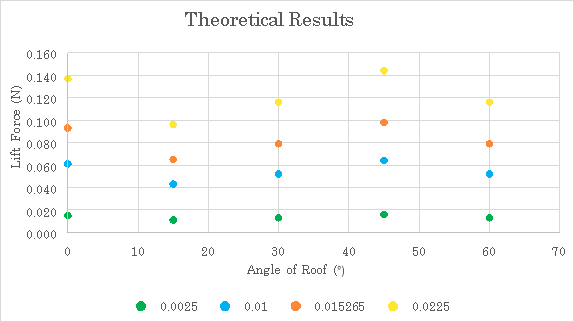
Graph 1 (created using MS Excel)
Based on these calculations, it can be assumed that the lift force will always peak at around 45°, reach the minimum around 15° and follow an identical pattern for each roof size[AR8].
Based on the above background research, a hypothesis can be formulated regarding the factors affecting lift force. It can be hypothesized that:
“The lift applied to a surface in wind is dependent on its surface area and angle relative to the airflow. This relationship peaks towards larger angles and surface areas.”[AR9]
An electronic balance was set up on a workbench and turned on, ensuring the units were set to grams. An electronic balanced was utilised for this experiment because lift, as a force, can be recorded by measuring how much mass is being lifted away from the balance (in negatives) and converting this into Newtons. The fan was placed approximately 0.3m away from the electronic balance, adjusted to direct the airflow directly above the balance. The base piece of cardboard, measuring 0.1m by 0.15m (10cm2 by 15cm2), was attached to the balance with electrical tape, ensuring the edge (not the flat side) was directed at the fan. The first “roof” piece (measuring 0.0025m2, or 25cm2) was attached to the base piece, then the balance was TARED. The fan was turned on, set at speed “1”. Three results were recorded from the balance[AR10] before the fan was turned off. The “roof” piece was removed, the first angled piece (at 15°) attached the “roof” piece re-fixed. The balance was again TARED and the fan was then turned back on, three results recorded and turned off again. This process was repeated for every “roof” piece (measuring 0.0025m2/25cm2, 0.01m2/100cm2, 0.015265m2/156.25cm2 and 0.0225m2[AR11]/225cm2) fixed to every angled piece (at 15°, 30°, 45°, 60° and 0°). An average was later taken of each group of results, and these averages were graphed in Excel for further in-depth analysis.
There were several variables involved with this experiment. The independent variables were the wind speed (which was controlled by using of the same fan), the roof area and the roof angle, and the dependent variable was the lift. The controlled variables included the use of the same[AR12] electronic balance, roof, angle and base pieces and the same speed setting on the fan, the position of the fan/airflow, the position of the scales and the position of the base piece and, by extension the roof structures.[AR13] These variables were controlled to ensure that all results are viable and in agreement.

In order to maintain safety in this experiment, the following procedures were implemented: Safety glasses were worn, the electronic equipment was kept away from water, the guard around the blades was not touched while the fan was running, the cardboard was handled carefully so as not to cause paper cuts and, likewise, when the cardboard pieces were cut out the scissors were handled with care.[AR14]
|
Lift Applied to Roofs of Different Areas and Inclinations |
||||
|
0.0025 m2 |
0.01 m2 |
0.015265 m2 |
0.0225 m2 |
|
|
0° |
0.056N |
0.175N |
0.250N |
0.287N |
|
15° |
0.075N |
0.186N |
0.259N |
0.242N |
|
30° |
0.103N |
0.159N |
0.159N |
-0.640N |
|
45° |
0.111N |
-0.556N |
-0.620N |
-0.770N |
|
60° |
0.056N |
-0.631N |
-0.715N |
-0.787N |
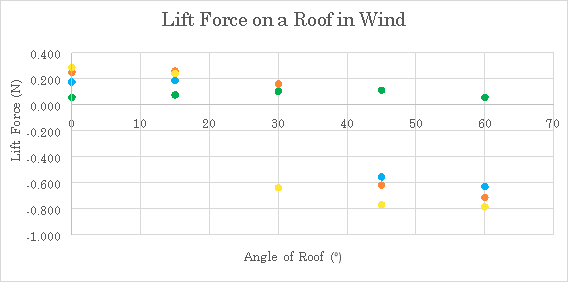 Table 2 (created using MS Excel)

Overall, the results of this experiment are plausible [AR16]at best. When comparing the empirical data to the theoretical data listed above, there are very few similarities and patterns. However, on close examination of the results there are several small connections. For example, even though each set of points has a different pattern, most of these patterns are similar in shape, and each set peaks at or before 45°. However, from here the theoretical and empirical are completely different. A likely reason for the dramatic differences between the two sets of results is the conditions under which the experiment was performed. Despite the actions taken, there were still a number of uncontrollable variables that may have affected the outcomes recorded. For example, the air-conditioning unit operating on the roof may have disrupted the airflow, resulting in a less continuous stream and thus a more unpredictable amount of lift. Similarly, the fan used in the experiment may not have provided a strong enough direct flow of air to the structure, also causing anomalous results[AR17].
However, despite the obvious anomalies in results, the experiment still manages to examine the relationship between angle of attack, surface area and lift force. For three of the four data sets (excluding 0.0025m2) the graphs follow a very similar pattern, indicating that the results are accurate in terms of the relationship, not the actual data observed. In addition, all data sets drop off after they reach 45°, showing that, just as observed in the theoretical results, lift force reaches its peak at around 45° inclination into the wind. The most likely reason for this is that past this inclination the structure presents a greater amount of its surface into the wind, allowing it to be pushed down. This phenomenon creates the positive mass results seen in the table above. This was not accounted for in the theoretical equations, which may have caused some of the anomalous results stated above[AR18].
Another prominent difference between empirical and theoretical results is the distinct differences between lift values in the theoretical data. These data sets remain at a fixed distance apart for the entire graph, directly opposed to the empirical data points which for the most part are plotted very close together. This illustrates a lower difference in lift force between different surface areas, however these results are likely due to the unstable nature of the structure used in the experiment. [AR19]Particularly in terms of the larger roof pieces, the structure became more unsteady, possibly resulting in the lower lift force recorded above. In terms of the patterns observed in the empirical data, the larger roof sizes do produce more lift, however past their peak they also create more downward force. While the smallest size does generate the greatest lift, the three larger sizes do produce an increasing amount of lift, in comparison with each other.
As mentioned previously, the structure used in the experiment, particularly with the larger roof piece attached, was very unstable. [AR20]This is a likely reason for the outlying point for the area of 0.0225m2 at an inclination of 30°. This surface area is the largest used, and it was very unstable atop the base piece, often sliding to the side and not remaining square with the base. Most likely, this instability is what has caused such an obvious anomaly, as the roof piece sliding may have exposed a larger surface area to the airflow, thus created more downward force and less upward lift.
Therefore, with the above considerations it mind, and despite the severe anomalies between theoretical and empirical data, the hypothesis of:
“The lift applied to a surface in wind is dependent on its surface area and angle relative to the airflow. This relationship peaks towards larger angles and surface areas.”
Is supported by this experiment.[AR21]
When performing an experiment, there are always a multitude of variables that affect the outcome, and a variety of ways in which the processes can be improved upon to achieve a better result. For example, in this experiment an ordinary household fan was used to generate the required airflow. Such a device is designed to provide air to an entire room, not to provide a direct flow of air such as is required to make this experiment a success. To make the experiment more successful, a more direct airflow should be utilised, possibly by making use of a wind tunnel, or even a hair dryer[AR22].
Similarly, the electronic balance used to take measurements was only a small, relatively simple piece of equipment. Also, as previously mentioned, the air-conditioning unit in the room was likely disrupting the already-unsteady airflow. This, along with the experiment’s position next to the doorway and the other people in the room, may have been the cause of the discrepant results, which often differed by up to 0.0015kg. To solve this, the experiment could be re-conducted in a controlled environment with nothing affecting the more direct airflow. Additionally, a more accurate electronic balance could be used[AR23]. A more accurate balance would a piece of equipment connected to a computer that records all results for each set of tests and identifies an accurate average.
The most prominent issue with the experiment was the results created by the electronic balance. The results were greatly varied, as stated above, suggesting that there were several uncontrolled variables at play, affecting the data. There are several methods that could be employed to rectify this, including those already mentioned. Performing the experiment in an isolated area where all variables can be controlled so nothing can interfere with the results is the most likely way to generate more accurate results. This, coupled with the use of a more stable structure (i.e. made from a sturdier material and fixed for effectively), a more accurate airflow and more sophisticated measuring technologies, is the best course to re-perform the experiment and give more viable results.
References
Actforlibraries.org, 2017. Bernoullis Principle of Lift. [Online]
Available at: http://www.actforlibraries.org/bernoullis-principle-of-lift-4/
[Accessed 04 March 2017].
Aerodynamics for Students, 2016. Lift and Lift Coefficient. [Online]
Available at: http://s6.aeromech.usyd.edu.au/aerodynamics/index.php/sample-page/aircraft-performance/lift-and-lift-coefficient/
[Accessed 04 March 2017].
Benson, T., 2014. Lift Formula. [Online]
Available at: https://www.grc.nasa.gov/www/k-12/WindTunnel/Activities/lift_formula.html
[Accessed 09 March 2017].
Cavcar, M., N/A. The International Standard Atmosphere. [Online]
Available at: http://home.anadolu.edu.tr/~mcavcar/common/ISAweb.pdf
[Accessed 04 March 2017].
Hall, N., 2015. Inclination Effects on Lift. [Online]
Available at: https://www.grc.nasa.gov/www/k-12/airplane/incline.html
[Accessed 19 March 2017].
Hall, N., 2015. Lift Equation. [Online]
Available at: https://www.grc.nasa.gov/www/k-12/airplane/vel.html
[Accessed 02 March 2017].
Hall, N., 2015. The Lift Coefficient. [Online]
Available at: https://www.grc.nasa.gov/www/k-12/airplane/liftco.html
[Accessed 04 March 2017].
Hall, N., 2015. Velocity Effects on Aerodynamic Forces. [Online]
Available at: https://www.grc.nasa.gov/www/k-12/airplane/vel.html
[Accessed 02 March 2017].
Hewitt, P. G., 2004. Bernoulli’s Principle. [Online]
Available at: http://www.nsta.org/publications/news/story.aspx?id=49598
[Accessed 02 March 2017].
Hodanbosi, C., 1996. Lift Formula. [Online]
Available at: https://www.grc.nasa.gov/www/k-12/WindTunnel/Activities/lift_formula.html
[Accessed 02 March 2017].
HyperPhysics, N/A. Bernoulli Equation. [Online]
Available at: http://hyperphysics.phy-astr.gsu.edu/hbase/pber.html
[Accessed 02 March 2017].
Jeff, S., 2003. Airfoils at High Angles of Attack. [Online]
Available at: http://www.aerospaceweb.org/question/airfoils/q0150b.shtml
[Accessed 04 March 2017].
Physics Forum, 2011. Fluid mechanics; Lift Force on a Roof; Bernoulli’s Equation. [Online]
Available at: https://www.physicsforums.com/threads/fluid-mechanics-lift-force-on-a-roof-bernoullis-equation.533145/
[Accessed 02 March 2017].
Scott, J., 2003. Airfoils at High Angle of Attack. [Online]
Available at: http://www.aerospaceweb.org/question/airfoils/q0150b.shtml
[Accessed 04 March 2017].
Scott, J., 2003. Lift Coefficient & Thin Airfoil Theory. [Online]
Available at: http://www.aerospaceweb.org/question/aerodynamics/q0136.shtml
[Accessed 04 March 2017].
Cite This Work
To export a reference to this article please select a referencing stye below:
Related Services
View all


DMCA / Removal Request
If you are the original writer of this essay and no longer wish to have your work published on UKEssays.com then please click the following link to email our support team:
Request essay removal